QQQ   337.27 (+1.86%)
AAPL   175.05 (+1.37%)
MSFT   318.52 (+1.44%)
META   246.85 (+1.80%)
GOOGL   122.83 (+1.65%)
AMZN   118.15 (+2.29%)
TSLA   176.89 (+1.74%)
NVDA   316.78 (+4.97%)
NIO   7.82 (-2.62%)
BABA   85.77 (-5.41%)
AMD   107.93 (+4.03%)
T   16.55 (-0.66%)
F   11.64 (+1.22%)
MU   67.57 (+4.08%)
CGC   1.05 (+0.00%)
GE   104.01 (+0.52%)
DIS   93.76 (+1.07%)
AMC   5.07 (-0.59%)
PFE   36.48 (-0.73%)
PYPL   61.27 (-0.31%)
NFLX   371.29 (+9.22%)

Energy Stocks List

Compare energy stocks and their fundamentals, performance, price, and technicals. Use this free stock comparison tool to evaluate companies based on their analyst ratings, book value, debt, dividend, MarketRank, news sentiment, price performance, profitability, and more. Enter up to ten stock symbols separated by a comma or space (ex. BAC, JPM, WFC, C, GS).

Learn more about trading energy stocks.

Compare Stocks - Price & Volume

CompanyCurrent Price50-Day Moving Average52-Week RangeMarket CapBetaAvg. VolumeToday's Volume
ConocoPhillips stock logo
COP
ConocoPhillips
$100.74
+0.0%
$101.58
$78.30
$138.49
$121.90 B1.36.43 million shs5.50 million shs
Chevron Co. stock logo
CVX
Chevron
$154.01
-0.1%
$162.58
$132.54
$189.68
$291.79 B1.168.16 million shs7.46 million shs
EOG Resources, Inc. stock logo
EOG
EOG Resources
$112.02
+1.1%
$113.80
$92.16
$150.88
$65.52 B1.533.62 million shs2.46 million shs
Kinder Morgan, Inc. stock logo
KMI
Kinder Morgan
$16.52
+0.4%
$17.11
$15.77
$20.20
$37.02 B0.9412.74 million shs12.06 million shs
Marathon Petroleum Co. stock logo
MPC
Marathon Petroleum
$110.98
+0.3%
$123.45
$77.62
$138.83
$47.09 B1.643.98 million shs3.35 million shs
Phillips 66 stock logo
PSX
Phillips 66
$96.28
+1.6%
$98.47
$74.02
$113.53
$44.18 B1.383.60 million shs4.39 million shs
Pioneer Natural Resources stock logo
PXD
Pioneer Natural Resources
$203.97
+0.0%
$208.33
$177.26
$288.46
$47.68 B1.422.45 million shs1.76 million shs
Royal Dutch Shell plc stock logo
RDS.A
Royal Dutch Shell
$51.04
$39.13
$21.25
$61.17
$199.25 B0.835.43 million shsN/A
Schlumberger Limited stock logo
SLB
Schlumberger
$44.85
+0.8%
$48.30
$30.65
$62.78
$63.70 B1.769.65 million shs8.37 million shs
The Williams Companies, Inc. stock logo
WMB
Williams Companies
$29.21
+0.9%
$29.48
$27.80
$37.97
$35.58 B1.166.89 million shs6.38 million shs

Price Performance

Company1-Day Performance7-Day Performance30-Day Performance90-Day Performance1-Year Performance
ConocoPhillips stock logo
COP
ConocoPhillips
+2.69%+0.24%-4.64%-7.06%-5.90%
Chevron Co. stock logo
CVX
Chevron
+1.43%-0.88%-8.90%-6.52%-10.53%
EOG Resources, Inc. stock logo
EOG
EOG Resources
+2.95%-1.21%-8.26%-11.46%-13.04%
Kinder Morgan, Inc. stock logo
KMI
Kinder Morgan
+0.92%-2.03%-7.48%-9.07%-16.67%
Marathon Petroleum Co. stock logo
MPC
Marathon Petroleum
+3.63%-0.98%-14.44%-12.55%+13.41%
Phillips 66 stock logo
PSX
Phillips 66
+3.16%+0.59%-8.79%-9.65%-3.00%
Pioneer Natural Resources stock logo
PXD
Pioneer Natural Resources
+1.38%-2.46%-10.63%-5.74%-26.24%
Royal Dutch Shell plc stock logo
RDS.A
Royal Dutch Shell
0.00%0.00%0.00%0.00%0.00%
Schlumberger Limited stock logo
SLB
Schlumberger
+2.89%-2.97%-14.52%-20.22%+3.61%
The Williams Companies, Inc. stock logo
WMB
Williams Companies
+1.05%-0.72%-4.52%-9.78%-19.36%

MarketRank™

CompanyOverall ScoreAnalyst's OpinionShort Interest ScoreDividend StrengthESG ScoreNews and Social Media SentimentCompany OwnershipEarnings & Valuation
ConocoPhillips stock logo
COP
ConocoPhillips
3.4944 of 5 stars
4.45.03.30.02.63.33.8
Chevron Co. stock logo
CVX
Chevron
3.3853 of 5 stars
4.35.05.00.01.81.73.8
EOG Resources, Inc. stock logo
EOG
EOG Resources
3.3378 of 5 stars
4.45.03.30.22.41.73.8
Kinder Morgan, Inc. stock logo
KMI
Kinder Morgan
2.3381 of 5 stars
2.15.02.50.82.72.51.9
Marathon Petroleum Co. stock logo
MPC
Marathon Petroleum
2.8359 of 5 stars
4.43.02.50.02.12.52.5
Phillips 66 stock logo
PSX
Phillips 66
2.5952 of 5 stars
3.33.03.30.03.01.72.5
Pioneer Natural Resources stock logo
PXD
Pioneer Natural Resources
2.8447 of 5 stars
4.34.02.50.02.31.72.5
Royal Dutch Shell plc stock logo
RDS.A
Royal Dutch Shell
N/AN/AN/AN/AN/AN/AN/AN/A
Schlumberger Limited stock logo
SLB
Schlumberger
3.1278 of 5 stars
3.53.02.51.82.32.54.4
The Williams Companies, Inc. stock logo
WMB
Williams Companies
2.5567 of 5 stars
3.25.02.50.91.93.31.3

Analyst Ratings

CompanyConsensus Rating ScoreConsensus RatingConsensus Price Target% Upside from Current Price
ConocoPhillips stock logo
COP
ConocoPhillips
2.81
Moderate Buy$137.6836.67% Upside
Chevron Co. stock logo
CVX
Chevron
2.58
Moderate Buy$193.1725.42% Upside
EOG Resources, Inc. stock logo
EOG
EOG Resources
2.87
Moderate Buy$149.5433.50% Upside
Kinder Morgan, Inc. stock logo
KMI
Kinder Morgan
2.11
Hold$20.5624.43% Upside
Marathon Petroleum Co. stock logo
MPC
Marathon Petroleum
2.85
Moderate Buy$142.9328.79% Upside
Phillips 66 stock logo
PSX
Phillips 66
2.64
Moderate Buy$121.8026.51% Upside
Pioneer Natural Resources stock logo
PXD
Pioneer Natural Resources
2.65
Moderate Buy$259.5527.25% Upside
Royal Dutch Shell plc stock logo
RDS.A
Royal Dutch Shell
0.00
N/AN/AN/A
Schlumberger Limited stock logo
SLB
Schlumberger
2.94
Moderate Buy$64.5343.89% Upside
The Williams Companies, Inc. stock logo
WMB
Williams Companies
2.31
Hold$35.4221.25% Upside

Current Analyst Ratings

Latest Energy Stocks Analyst Ratings

DateCompanyBrokerageActionRatingPrice TargetDetails
5/18/2023
ConocoPhillips stock logo
COP
ConocoPhillips
Piper Sandler
Subscribe to MarketBeat All Access for the recommendation accuracy rating
Boost Price Target$140.00 ➝ $149.00
5/18/2023
Chevron Co. stock logo
CVX
Chevron
Piper Sandler
Subscribe to MarketBeat All Access for the recommendation accuracy rating
Lower Price Target$203.00 ➝ $196.00
5/18/2023
EOG Resources, Inc. stock logo
EOG
EOG Resources
Piper Sandler
Subscribe to MarketBeat All Access for the recommendation accuracy rating
Lower Price Target$171.00 ➝ $170.00
5/18/2023
Marathon Petroleum Co. stock logo
MPC
Marathon Petroleum
Piper Sandler
Subscribe to MarketBeat All Access for the recommendation accuracy rating
Lower Price Target$154.00 ➝ $138.00
5/18/2023
Phillips 66 stock logo
PSX
Phillips 66
Piper Sandler
Subscribe to MarketBeat All Access for the recommendation accuracy rating
Lower Price Target$141.00 ➝ $127.00
5/16/2023
The Williams Companies, Inc. stock logo
WMB
Williams Companies
Citigroup
Subscribe to MarketBeat All Access for the recommendation accuracy rating
UpgradeNeutral ➝ Buy$36.00
5/15/2023
ConocoPhillips stock logo
COP
ConocoPhillips
Morgan Stanley
Subscribe to MarketBeat All Access for the recommendation accuracy rating
Boost Price Target$122.00 ➝ $124.00
5/15/2023
EOG Resources, Inc. stock logo
EOG
EOG Resources
Jefferies Financial Group
Subscribe to MarketBeat All Access for the recommendation accuracy rating
Lower Price Target$147.00 ➝ $138.00
5/15/2023
Pioneer Natural Resources stock logo
PXD
Pioneer Natural Resources
Morgan Stanley
Subscribe to MarketBeat All Access for the recommendation accuracy rating
Boost Price Target$221.00 ➝ $223.00
5/12/2023
Phillips 66 stock logo
PSX
Phillips 66
The Goldman Sachs Group
Subscribe to MarketBeat All Access for the recommendation accuracy rating
Lower Price Target$124.00 ➝ $119.00
5/7/2023
Marathon Petroleum Co. stock logo
MPC
Marathon Petroleum
Barclays
Subscribe to MarketBeat All Access for the recommendation accuracy rating
Lower Price Target$139.00 ➝ $124.00
(Data available from 5/18/2020 forward. View 10+ years of historical ratings with our analyst ratings screener.)

Sales & Book Value

CompanyAnnual RevenuePrice/SalesCashflowPrice/CashBook ValuePrice/Book
ConocoPhillips stock logo
COP
ConocoPhillips
$82.16B1.48$20.69 per share4.87$39.49 per share2.55
Chevron Co. stock logo
CVX
Chevron
$246.25B1.18$27.70 per share5.56$84.68 per share1.82
EOG Resources, Inc. stock logo
EOG
EOG Resources
$25.70B2.55$20.59 per share5.44$43.51 per share2.57
Kinder Morgan, Inc. stock logo
KMI
Kinder Morgan
$19.20B1.93$2.21 per share7.48$14.33 per share1.15
Marathon Petroleum Co. stock logo
MPC
Marathon Petroleum
$174.26B0.27$37.24 per share2.98$77.06 per share1.44
Phillips 66 stock logo
PSX
Phillips 66
$168.21B0.26$23.37 per share4.12$76.09 per share1.27
Pioneer Natural Resources stock logo
PXD
Pioneer Natural Resources
$24.29B1.96$43.31 per share4.71$93.43 per share2.18
Royal Dutch Shell plc stock logo
RDS.A
Royal Dutch Shell
$183.20B1.09$14.67 per share3.48$40.61 per share1.26
Schlumberger Limited stock logo
SLB
Schlumberger
$28.09B2.27$3.86 per share11.62$12.94 per share3.47
The Williams Companies, Inc. stock logo
WMB
Williams Companies
$10.97B3.25$3.61 per share8.10$11.73 per share2.49

Profitability & Earnings

CompanyNet IncomeEPSTrailing P/E RatioForward P/E RatioP/E GrowthNet MarginsReturn on Equity (ROE)Return on Assets (ROA)Next Earnings Date
ConocoPhillips stock logo
COP
ConocoPhillips
$18.68B$12.508.068.850.5320.21%32.75%17.09%8/3/2023 (Estimated)
Chevron Co. stock logo
CVX
Chevron
$35.47B$18.528.329.990.7614.74%23.15%14.25%8/4/2023 (Estimated)
EOG Resources, Inc. stock logo
EOG
EOG Resources
$7.76B$15.997.018.690.3233.83%30.34%18.16%8/3/2023 (Estimated)
Kinder Morgan, Inc. stock logo
KMI
Kinder Morgan
$2.55B$1.1314.6214.624.9813.62%8.06%3.71%7/19/2023 (Estimated)
Marathon Petroleum Co. stock logo
MPC
Marathon Petroleum
$14.52B$33.193.349.020.889.28%46.49%16.93%8/1/2023 (Estimated)
Phillips 66 stock logo
PSX
Phillips 66
$11.02B$25.863.727.920.337.13%32.37%13.98%8/4/2023 (Estimated)
Pioneer Natural Resources stock logo
PXD
Pioneer Natural Resources
$7.85B$28.217.238.741.0931.15%30.71%19.31%8/1/2023 (Estimated)
Royal Dutch Shell plc stock logo
RDS.A
Royal Dutch Shell
-$21.68B$1.1644.007.251.812.03%8.01%3.38%N/A
Schlumberger Limited stock logo
SLB
Schlumberger
$3.44B$2.6916.6711.930.4912.94%20.16%8.17%7/28/2023 (Estimated)
The Williams Companies, Inc. stock logo
WMB
Williams Companies
$2.05B$2.1313.7116.504.3222.53%17.24%4.99%8/7/2023 (Estimated)

Latest Energy Stocks Earnings

DateQuarterCompanyConsensus EstimateReported EPSBeat/MissGap EPSRevenue EstimateActual RevenueDetails
5/5/2023Q1 2023
EOG Resources, Inc. stock logo
EOG
EOG Resources
$2.42$2.69+$0.27$1.93$5.28 billion$6.04 billion    
5/4/2023Q1 2023
ConocoPhillips stock logo
COP
ConocoPhillips
$2.02$2.38+$0.36$2.38$16.06 billion$15.52 billion      
5/3/2023Q1 2023
Phillips 66 stock logo
PSX
Phillips 66
$3.58$4.21+$0.63$4.22$29.76 billion$35.09 billion    
5/3/2023Q1 2023
The Williams Companies, Inc. stock logo
WMB
Williams Companies
$0.46$0.56+$0.10$0.36$2.65 billion$3.08 billion    
5/2/2023Q1 2023
Marathon Petroleum Co. stock logo
MPC
Marathon Petroleum
$5.23$6.09+$0.86$6.09$35.17 billion$35.08 billion      
4/28/2023Q1 23
Chevron Co. stock logo
CVX
Chevron
$3.41$3.55+$0.14$3.64$49.49 billion$50.79 billion      
4/26/2023Q1 2023
Pioneer Natural Resources stock logo
PXD
Pioneer Natural Resources
$4.90$5.21+$0.31$5.42$4.98 billion$4.54 billion    
4/21/2023Q1 23
Schlumberger Limited stock logo
SLB
Schlumberger
$0.61$0.63+$0.02$0.61$7.46 billion$7.74 billion    
4/19/2023Q1 23
Kinder Morgan, Inc. stock logo
KMI
Kinder Morgan
$0.29$0.30+$0.01$0.30$4.75 billion$3.89 billion      
2/24/2023Q4 22
EOG Resources, Inc. stock logo
EOG
EOG Resources
$3.31$3.30-$0.01$2.73$6.09 billion$6.72 billion      
2/22/2023Q4 22
Pioneer Natural Resources stock logo
PXD
Pioneer Natural Resources
$5.83$5.91+$0.08$5.84$5.59 billion$5.11 billion      

Dividends

CompanyAnnual PayoutDividend Yield3-Year Dividend GrowthPayout RatioYears of Consecutive Growth
ConocoPhillips stock logo
COP
ConocoPhillips
$2.042.03%+12.29%16.32%6 Years
Chevron Co. stock logo
CVX
Chevron
$6.043.92%+6.07%32.61%37 Years
EOG Resources, Inc. stock logo
EOG
EOG Resources
$3.302.95%+41.62%20.64%6 Years
Kinder Morgan, Inc. stock logo
KMI
Kinder Morgan
$1.136.84%+5.09%100.00%6 Years
Marathon Petroleum Co. stock logo
MPC
Marathon Petroleum
$3.002.70%+5.51%9.04%1 Years
Phillips 66 stock logo
PSX
Phillips 66
$4.204.36%+3.05%16.24%3 Years
Pioneer Natural Resources stock logo
PXD
Pioneer Natural Resources
$4.402.16%N/A15.60%N/A
Royal Dutch Shell plc stock logo
RDS.A
Royal Dutch Shell
$1.923.76%N/A165.52%N/A
Schlumberger Limited stock logo
SLB
Schlumberger
$1.002.23%-31.25%37.17%2 Years
The Williams Companies, Inc. stock logo
WMB
Williams Companies
$1.796.13%+3.80%84.04%7 Years

Latest Energy Stocks Dividends

AnnouncementCompanyPeriodAmountYieldEx-Dividend DateRecord DatePayable Date
5/4/2023
EOG Resources, Inc. stock logo
EOG
EOG Resources
quarterly$0.82502.96%7/14/20237/17/20237/31/2023
4/20/2023
Schlumberger Limited stock logo
SLB
Schlumberger
quarterly$0.251.92%6/6/20236/7/20237/13/2023
4/25/2023
The Williams Companies, Inc. stock logo
WMB
Williams Companies
quarterly$0.44756.1%6/9/20236/12/20236/26/2023
4/26/2023
Pioneer Natural Resources stock logo
PXD
Pioneer Natural Resources
quarterly$3.346.01%5/31/20236/1/20236/21/2023
4/28/2023
Chevron Co. stock logo
CVX
Chevron
Quarterly$1.513.58%5/18/20235/19/20236/12/2023
4/26/2023
Marathon Petroleum Co. stock logo
MPC
Marathon Petroleum
quarterly$0.752.43%5/16/20235/17/20236/12/2023
5/4/2023
ConocoPhillips stock logo
COP
ConocoPhillips
quarterly$0.512.12%6/26/20235/16/20236/1/2023
5/10/2023
Phillips 66 stock logo
PSX
Phillips 66
Quarterly$1.054.5%5/19/20235/22/20236/1/2023
4/19/2023
Kinder Morgan, Inc. stock logo
KMI
Kinder Morgan
quarterly$0.28256.4%4/28/20235/1/20235/15/2023
2/23/2023
EOG Resources, Inc. stock logo
EOG
EOG Resources
quarterly$0.82502.9%4/13/20234/14/20234/28/2023
2/23/2023
EOG Resources, Inc. stock logo
EOG
EOG Resources
Quarterly$0.82502.89%3/15/20233/16/20233/30/2023
(Data available from 1/1/2013 forward)

Debt

CompanyDebt-to-Equity RatioCurrent RatioQuick Ratio
ConocoPhillips stock logo
COP
ConocoPhillips
0.32
1.39
1.29
Chevron Co. stock logo
CVX
Chevron
0.13
1.43
1.16
EOG Resources, Inc. stock logo
EOG
EOG Resources
0.15
2.17
1.90
Kinder Morgan, Inc. stock logo
KMI
Kinder Morgan
0.91
0.56
0.44
Marathon Petroleum Co. stock logo
MPC
Marathon Petroleum
0.83
1.90
1.30
Phillips 66 stock logo
PSX
Phillips 66
0.51
1.54
1.17
Pioneer Natural Resources stock logo
PXD
Pioneer Natural Resources
0.23
0.88
0.76
Royal Dutch Shell plc stock logo
RDS.A
Royal Dutch Shell
0.51
1.26
1.03
Schlumberger Limited stock logo
SLB
Schlumberger
0.58
1.26
0.91
The Williams Companies, Inc. stock logo
WMB
Williams Companies
1.59
0.69
0.63

Ownership

Miscellaneous

CompanyEmployeesShares OutstandingFree FloatOptionable
ConocoPhillips stock logo
COP
ConocoPhillips
9,5001.21 billion1.21 billionOptionable
Chevron Co. stock logo
CVX
Chevron
43,8461.89 billion1.89 billionOptionable
EOG Resources, Inc. stock logo
EOG
EOG Resources
2,850584.86 million582.52 millionOptionable
Kinder Morgan, Inc. stock logo
KMI
Kinder Morgan
10,5252.24 billion1.96 billionOptionable
Marathon Petroleum Co. stock logo
MPC
Marathon Petroleum
17,800424.28 million423.10 millionOptionable
Phillips 66 stock logo
PSX
Phillips 66
13,000458.86 million437.89 millionOptionable
Pioneer Natural Resources stock logo
PXD
Pioneer Natural Resources
2,076233.74 million232.45 millionOptionable
Royal Dutch Shell plc stock logo
RDS.A
Royal Dutch Shell
87,0003.90 billion3.86 billionNot Optionable
Schlumberger Limited stock logo
SLB
Schlumberger
99,0001.42 billion1.42 billionOptionable
The Williams Companies, Inc. stock logo
WMB
Williams Companies
5,0431.22 billion1.21 billionOptionable

Energy Stocks Headlines

SourceHeadline
Williams Companies (NYSE:WMB) Now Covered by StockNews.comWilliams Companies (NYSE:WMB) Now Covered by StockNews.com
marketbeat.com - May 18 at 2:47 AM
RBC Capital Reiterates Williams Cos (WMB) Outperform RecommendationRBC Capital Reiterates Williams Cos (WMB) Outperform Recommendation
msn.com - May 17 at 8:44 PM
Citigroup Upgrades Williams Cos (WMB)Citigroup Upgrades Williams Cos (WMB)
msn.com - May 16 at 5:32 PM
Williams Companies (NYSE:WMB) Upgraded to "Buy" at CitigroupWilliams Companies (NYSE:WMB) Upgraded to "Buy" at Citigroup
americanbankingnews.com - May 16 at 7:50 AM
Polaris Capital Management LLC Has $59.40 Million Stake in The Williams Companies, Inc. (NYSE:WMB)Polaris Capital Management LLC Has $59.40 Million Stake in The Williams Companies, Inc. (NYSE:WMB)
marketbeat.com - May 12 at 1:37 PM
The Williams Companies Falls Short Despite A Long Dividend HistoryThe Williams Companies Falls Short Despite A Long Dividend History
msn.com - May 12 at 9:01 AM
Williams Companies Posts Solid Q1 Results; Projects To Come Online QuickerWilliams Companies Posts Solid Q1 Results; Projects To Come Online Quicker
msn.com - May 11 at 10:59 PM
Williams Companies $WMB Trading ReportWilliams Companies $WMB Trading Report
marketwatch.com - May 11 at 2:25 AM
Williams Companies: Too Good To Pass Up At 6.7x Price To Cash FlowWilliams Companies: Too Good To Pass Up At 6.7x Price To Cash Flow
msn.com - May 10 at 10:42 AM
Prospera Financial Services Inc Increases Holdings in The Williams Companies, Inc. (NYSE:WMB)Prospera Financial Services Inc Increases Holdings in The Williams Companies, Inc. (NYSE:WMB)
marketbeat.com - May 10 at 7:47 AM
Analysts Set The Williams Companies, Inc. (NYSE:WMB) Target Price at $35.42Analysts Set The Williams Companies, Inc. (NYSE:WMB) Target Price at $35.42
americanbankingnews.com - May 9 at 2:18 AM
Raymond James & Associates Increases Holdings in The Williams Companies, Inc. (NYSE:WMB)Raymond James & Associates Increases Holdings in The Williams Companies, Inc. (NYSE:WMB)
marketbeat.com - May 8 at 1:52 PM
The Williams Companies, Inc. (NYSE:WMB) Shares Acquired by Vectors Research Management LLCThe Williams Companies, Inc. (NYSE:WMB) Shares Acquired by Vectors Research Management LLC
marketbeat.com - May 7 at 10:55 AM
Bunge, Williams Companies And Shake Shack Feature On CNBCs Final TradesBunge, Williams Companies And Shake Shack Feature On CNBC's 'Final Trades'
msn.com - May 5 at 12:35 PM
State Board of Administration of Florida Retirement System Sells 57,570 Shares of The Williams Companies, Inc. (NYSE:WMB)State Board of Administration of Florida Retirement System Sells 57,570 Shares of The Williams Companies, Inc. (NYSE:WMB)
marketbeat.com - May 5 at 7:36 AM
Q1 2023 Williams Companies Inc Earnings CallQ1 2023 Williams Companies Inc Earnings Call
finance.yahoo.com - May 5 at 2:34 AM
The Williams Companies, Inc. 2023 Q1 - Results - Earnings Call PresentationThe Williams Companies, Inc. 2023 Q1 - Results - Earnings Call Presentation
seekingalpha.com - May 4 at 2:30 PM
Equity Investment Corp Reduces Position in The Williams Companies, Inc. (NYSE:WMB)Equity Investment Corp Reduces Position in The Williams Companies, Inc. (NYSE:WMB)
marketbeat.com - May 4 at 11:43 AM
Williams Companies, Inc. (The) (WMB) Q1 Earnings and Revenues Surpass EstimatesWilliams Companies, Inc. (The) (WMB) Q1 Earnings and Revenues Surpass Estimates
finance.yahoo.com - May 3 at 11:39 PM
Williams Companies, Inc. (The) (WMB) Q1 Earnings: Taking a Look at Key Metrics Versus EstimatesWilliams Companies, Inc. (The) (WMB) Q1 Earnings: Taking a Look at Key Metrics Versus Estimates
finance.yahoo.com - May 3 at 11:39 PM
Williams Cos. Q1 Profit Increases, beats estimatesWilliams Cos. Q1 Profit Increases, beats estimates
markets.businessinsider.com - May 3 at 6:39 PM
Williams breaks records for gas gathering volumes, contracted capacityWilliams breaks records for gas gathering volumes, contracted capacity
msn.com - May 3 at 6:39 PM
Williams Companies: Q1 Earnings InsightsWilliams Companies: Q1 Earnings Insights
msn.com - May 3 at 6:39 PM
Williams Reports Higher First-Quarter ResultsWilliams Reports Higher First-Quarter Results
finance.yahoo.com - May 3 at 6:39 PM

New MarketBeat Followers Over Time

Media Sentiment Over Time

Top Headlines

All Headlines

Company Descriptions

ConocoPhillips logo

ConocoPhillips

NYSE:COP
ConocoPhillips engages in the exploration, production, transportation and marketing of crude oil, bitumen, natural gas, natural gas liquids, and liquefied natural gas on a worldwide basis. It operates through the following geographical segments: Alaska, Lower 48, Canada, Europe, Middle East and North Africa, Asia Pacific, and Other International. The Alaska segment primarily explores for, produces, transports, and markets crude oil, natural gas, and natural gas liquids. The Lower 48 segment consists of operations in the U.S. and the Gulf of Mexico. The Canada segment consists of oil sands development in the Athabasca Region of northeastern Alberta and a liquids-rich unconventional play in western Canada. The Europe, Middle East and North Africa segment consists of operations and exploration activities in Norway, the United Kingdom and Libya. The Asia Pacific segment has explorations and product operations in China, Indonesia, Malaysia, and Australia. The Other International segment handles exploration activities in Columbia and Argentina. The company was founded in 1875 and is headquartered in Houston, TX.
Chevron logo

Chevron

NYSE:CVX
Chevron Corp. engages in the provision of administrative, financial management, and technology support for energy and chemical operations. It operates through the Upstream and Downstream segments. The Upstream segment consists of the exploration, development, and production of crude oil and natural gas, the liquefaction, transportation, and regasification associated with liquefied natural gas, the transporting of crude oil by major international oil export pipelines, the processing, transporting, storage, and marketing of natural gas, and a gas-to-liquids plant. The Downstream segment consists of the refining of crude oil into petroleum products, the marketing of crude oil and refined products, the transporting of crude oil and refined products by pipeline, marine vessel, motor equipment, and rail car, and the manufacturing and marketing of commodity petrochemicals and plastics for industrial uses and fuel & lubricant additives. The company was founded in 1906 and is headquartered in San Ramon, CA.
EOG Resources logo

EOG Resources

NYSE:EOG
EOG Resources, Inc. engages in the exploration, development, production and marketing of crude oil and natural gas. It operates through the United States, Trinidad & Tobago, and Other International segments. The company was founded in 1985 and is headquartered in Houston, TX.
Kinder Morgan logo

Kinder Morgan

NYSE:KMI
Kinder Morgan, Inc. engages in providing pipeline transportation of natural gas services. It operates through the following business segments: Natural Gas Pipelines, Products Pipelines, Terminals, and CO2. The Natural Gas Pipelines segment operates major interstate and intrastate natural gas pipelines and storage systems. The Products Pipelines segment is involved in the operation of refined petroleum products, crude oil, and condensate pipelines. The Terminals segment includes operation of liquids and bulk terminal facilities that store and handle various commodities. The CO2 segment produces, transports, and markets to oil fields that use CO2 as a flooding medium to increase recovery and production of crude oil from mature oil fields. The company was founded by Richard D. Kinder and William V. Morgan in February 1997 and is headquartered in Houston, TX.
Marathon Petroleum logo

Marathon Petroleum

NYSE:MPC
Marathon Petroleum Corp. is an independent company, which engages in the refining, marketing, and transportation of petroleum products in the United States. It operates through the following segments: Refining and Marketing, and Midstream. The Refining and Marketing segment refines crude oil and other feedstocks at its refineries in the Gulf Coast and Midwest regions of the United States, purchases ethanol and refined products for resale and distributes refined products through various means, including barges, terminals, and trucks that the company owns or operates. The Midstream segment transports, stores, distributes and markets crude oil and refined products principally for the Refining and Marketing segment via refining logistics assets, pipelines, terminals, towboats, and barges. It also gathers, processes, and transports natural gas, and gathers, transports, fractionates, stores, and markets NGLs. The company was founded in 1887 and is headquartered in Findlay, OH.
Phillips 66 logo

Phillips 66

NYSE:PSX
Phillips 66 engages in the processing, transportation, storage, and marketing of fuels and other related products. The company operates through the following segments: Midstream, Chemicals, Refining and Marketing & Specialties. The Midstream segment provides crude oil and refined products transportation, terminaling and processing services, as well as natural gas, natural gas liquids and liquefied petroleum gas transportation, storage, processing and marketing services. The Chemicals segment produces and markets petrochemicals and plastics on a worldwide basis. The Refining segment Refines crude oil and other feedstocks into petroleum products such as gasoline, distillates and aviation fuels. The Marketing and Specialties segment purchases for resale and markets refined petroleum products such as base oils and lubricants, as well as power generation operations. The company was founded in 1875 and is headquartered in Houston, TX.
Pioneer Natural Resources logo

Pioneer Natural Resources

NYSE:PXD
Pioneer Natural Resources Co. operates as an independent oil and gas exploration and production company. The firm engages in hydrocarbon exploration in the Cline Shale. It focuses on the operation of the Permian Basin, Eagle Ford Shale, Rockies, and West Panhandle projects. The company was founded by Scott Douglas Sheffield on April 2, 1997, and is headquartered in Irving, TX.
Royal Dutch Shell logo

Royal Dutch Shell

NYSE:RDS.A
Royal Dutch Shell plc operates as an energy and petrochemical company worldwide. The company operates through Integrated Gas, Upstream, Oil Products, Chemicals segments. It explores for and extracts crude oil, natural gas, and natural gas liquids; markets and transports oil and gas; produces gas-to-liquids fuels and other products; and operates upstream and midstream infrastructure necessary to deliver gas to market. The company also markets and trades natural gas, liquefied natural gas (LNG), crude oil, electricity, carbon-emission rights; and markets and sells LNG as a fuel for heavy-duty vehicles and marine vessels. In addition, it trades in and refines crude oil and other feed stocks, such as gasoline, diesel, heating oil, aviation fuel, marine fuel, biofuel, lubricants, bitumen, and sulphur; produces and sells petrochemicals for industrial use; and manages oil sands activities. Further, the company produces base chemicals comprising ethylene, propylene, and aromatics, as well as intermediate chemicals, such as styrene monomer, propylene oxide, solvents, detergent alcohols, ethylene oxide, and ethylene glycol. Royal Dutch Shell plc was founded in 1907 and is headquartered in The Hague, the Netherlands.
Schlumberger logo

Schlumberger

NYSE:SLB
Schlumberger NV engages in the provision of technology for reservoir characterization, drilling, production, and processing to the oil and gas industry. It operates through the following business segments: Digital and Integration, Reservoir Performance, Well Construction, and Production Systems. The Digital and Integration segment combines the company's digital solutions and data products with its Asset Performance Solutions (APS). The Reservoir Performance segment consists of reservoir-centric technologies and services that are critical to optimizing reservoir productivity and performance. The Well Construction segment includes the full portfolio of products and services to optimize well placement and performance, maximize drilling efficiency, and improve wellbore assurance. The Production Systems segment develops technologies and provides expertise that enhance production and recovery from subsurface reservoirs to the surface, into pipelines, and to refineries. The company was founded by Conrad Schlumberger and Marcel Schlumberger in 1926 and is headquartered in Houston, TX.
Williams Companies logo

Williams Companies

NYSE:WMB
The Williams Cos., Inc. operates as an energy infrastructure company, which explores, produces, transports, sells and processes natural gas and petroleum products. It operates through the following segments: Transmission and Gulf of Mexico, Northeast G&P, and West. The Transmission and Gulf of Mexico segment consists of interstate natural gas pipelines, the Transco and Northwest Pipelines, as well as natural gas gathering and processing and crude oil production handling and transportation assets in the Gulf Coast region. The Northeast G&P segment includes midstream gathering, processing, and fractionation businesses in the Marcellus Shale region primarily in Pennsylvania and New York, and the Utica Shale region of eastern Ohio. The West segment consists of gas gathering, processing, and treating operations in the Rocky Mountain region of Colorado and Wyoming, the Barnett Shale region of north-central Texas, the Eagle Ford Shale region of south Texas, the Haynesville Shale region of northwest Louisiana, and the Mid-Continent region which includes the Anadarko, Arkoma, and Permian basins. The company was founded by David Williams and Miller Williams in 1908 and is headquartered in Tu

Key Points

  • Investing in energy can diversify a portfolio and capitalize on the growing demand for energy worldwide.
  • Energy investments offer potential high returns, predictable cash flows and certain tax benefits but come with price volatility and political risks.
  • The best way to invest in energy depends on individual investment goals, but direct investments like stocks, ETFs or mutual funds offer more control and potential for higher returns.

Energy keeps the world moving, from oil to gas to solar to wind. Unsurprisingly, the energy sector is a vast, complex and ever-changing landscape. The sector is affected by new technologies and political developments worldwide. 

As exciting as all this is, it's no surprise you're wondering how to invest in energy. When this article is through, you'll have a better idea of the types of energy investments, where to find them and which may be best for your needs.

Overview of the Energy Industry 

The most direct investment method in the energy industry is buying energy sector stocks or mutual funds from companies across the energy spectrum, from big oil companies to alternative energy startups.

Investing in commodities such as crude oil, natural gas and coal offers another option. These are traded on commodities markets like the New York Mercantile Exchange (NYMEX). Commodities trading can be riskier than investing in stocks since prices can be affected by things like geopolitical events and weather patterns.

Finally, derivatives trading is another option. Derivatives are contracts that derive value from an underlying asset, such as a stock, commodity or currency. They can be traded on regulated exchanges and over-the-counter (OTC) markets. This type of trading is complex and carries more risk than the best energy stocks to buy now, as the prices can be much impacted by changing market conditions.

investing in energy

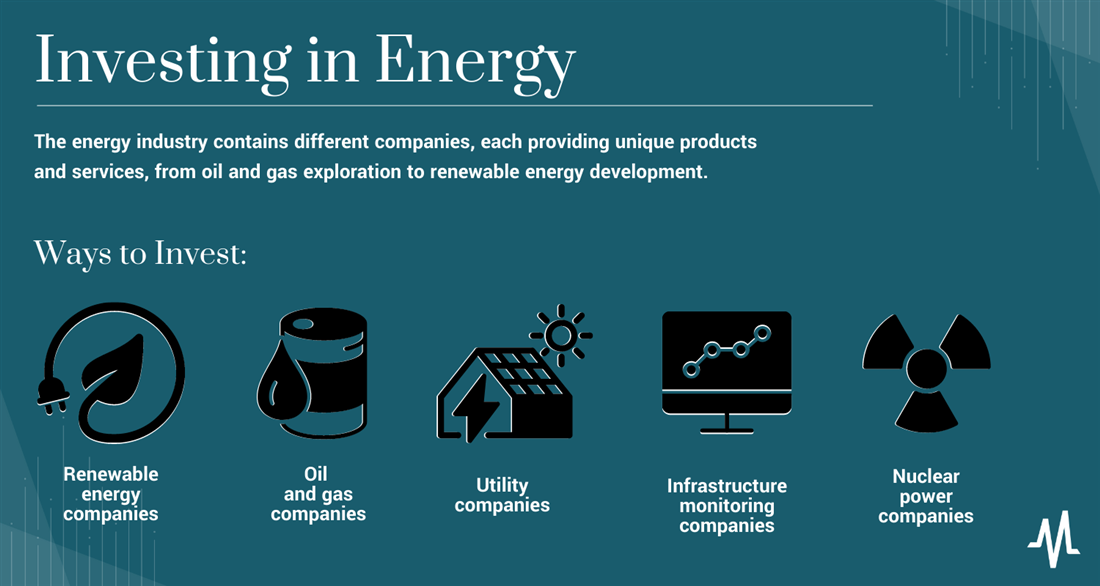
Types of Energy Companies 

The energy industry contains different companies, each providing unique products and services, from oil and gas exploration to renewable energy development.

Renewable Energy Companies

The renewable energy industry is booming. These companies generate power through solar, wind, geothermal and hydroelectricity. Solar energy is one of the most popular renewable energy investments. Companies like SunPower Corp. (NASDAQ: SPWR) and First Solar Inc. (NASDAQ: FSLR) produce photovoltaic (PV) panels that convert sunlight into electricity. Wind energy has also grown in popularity over the last few years, with companies such as Vestas Wind Systems A/S (OTCMKTS: VWSYF). Siemens Gamesa Renewable Energy SA (OTCMKTS: GCTAF) and Xinjiang Goldwind Science & Technology Co. Ltd. (OTCMKTS: XJNGF) making gains in this sector. 

Geothermal energy produces power by tapping into natural heat from underground, while hydroelectricity involves using water to turn turbines to generate electricity. Many renewable energy companies are publicly traded. Figuring out how to invest in renewable energy stocks can be a great way to get involved in the green movement while diversifying your portfolio.

Oil and Gas Companies

Oil and gas companies are also publicly traded. These companies explore, extract, refine and market petroleum products like gasoline, heating oil and diesel fuel. The types of oil and gas stocks are often categorized by the roles they play in the industry.

At the top of the chain are major oil and gas companies such as Exxon Mobil Corp. (NYSE: XOM), Chevron Corp. (NYSE: CVX), BP PLC (NYSE: BP) and Shell PLC (NYSE: SHEL). These giant corporations are involved in all aspects of the industry, from exploration to production to refining and distribution.

Exploration and production (E&P) companies focus specifically on finding new sources of oil and gas, then extracting them from the ground or seafloor. They often lease land for drilling rights.

Oilfield services firms provide support and technical services to E&P companies like drilling, well completion and maintenance. Some examples include Halliburton Co. (NYSE: HAL), Schlumberger Limited (NYSE: SLB) and Baker Hughes Co. (NASDAQ: BKR).

Midstream companies focus on the transportation and storage of oil and gas. They build and operate pipelines, storage tanks and other infrastructure to move oil and gas from the wellhead to refineries. Midstream companies are generally less volatile than E&P firms since their revenues tie to the volume of oil and gas produced rather than the price.

Finally, downstream companies refine and sell petroleum products to end-users such as gas stations, airlines and manufacturing. As a consumer, you might be most familiar with companies such as Phillips 66 (NYSE: PSX) and Valero Energy Partners (NYSE: VLP). Changes in demand and prices at the pump can impact them.

Utility Companies

Utilities generate and distribute electricity and natural gas to homes and businesses. These companies often operate in regulated markets, which can provide a stable source of revenue. Examples include Duke Energy Corp. (NYSE: DUK), The Southern Co. (NYSE: SO) and American Electric Power Company Inc. (NASDAQ: AEPPZ). Utility stocks can be a way to diversify your portfolio, as they can have lower volatility than other energy stocks.

Infrastructure Monitoring Companies 

Infrastructure monitoring companies ensure that energy networks and systems remain operational and secure. They monitor the system in real-time, detecting any irregularities that may indicate a malfunction or security breach. Companies such as Siemens Energy AG (OTCMKTS: SMEGF) and EnerNOC Inc. (NASDAQ: ENOC) specialize in monitoring services for renewable energy. These companies often have stable revenues as they provide critical services.

Nuclear Power Companies

The nuclear power industry relies on uranium-based fuel to generate electricity relatively cheaply and with environmental impact. But investing can be risky since the sector requires government approval and public trust, though it has the potential for high returns. Some well-known nuclear power companies include Exelon Corp. (NASDAQ: EXC), NextEra Energy Partners LP (NYSE: NEP) and Duke Energy. Approach this industry with caution and thoroughly research the companies you're considering.

How to Invest in Oil and Gas

Oil and gas investments can greatly diversify your portfolio and take advantage of potential growth. First, you can look for the best oil stocks and invest directly in them. But these can be volatile. When prices go up, so do stock prices. Even the top 50 oil and gas stocks suffer in value when prices drop. Be aware of current market conditions, and diversify so that gains on another can offset any losses on one stock.

Investing in E&P companies can be rewarding if you're willing to take risks. These firms experience wild price swings due to their exposure to volatile global commodity markets. If you have a lower risk tolerance, look into oilfield services firms and midstream or downstream oil companies' stock. Investments in utility and infrastructure monitoring companies can also help diversify your energy holdings. Nuclear power stocks also offer an opportunity if you're more risk-tolerant.

Another option is to invest in energy exchange-traded funds (ETFs). Energy ETFs track an index such as the S&P Global Energy Index or Dow Jones U.S. Energy Sector Index, which measures performance across all major energy sectors. Many ETFs also provide dividend payments.

If you read the news every day, you know oil and gas are subject to fluctuations in the global market. Ensure you're financially prepared for any swings.

How to Invest in Uranium

Since the dawn of the nuclear age, uranium has been a critical component used to power nuclear reactors, providing approximately 11% of the world's electricity in 2022. The price has shown steady growth over the past few years. But investing directly in uranium stocks or funds can be challenging due to their limited availability and thin trading volume.

One way is to purchase stocks in companies that produce uranium. They typically operate mines where they extract uranium ore and refine it. Some well-known stocks in this sector include Cameco Corp. (TSE: CCO) and Rio Tinto Group (NYSE: RIO).

You can also invest in ETFs tied to uranium prices. Two popular ETFs are the Global X Uranium ETF (NYSEARCA: URA) and the VanEck Vectors Nuclear Energy ETF (NYSEARCA: NLR). These funds track the Solactive Global Uranium Index.

Another way to invest is through purchasing physical uranium, either as ore or in refined form, and storing it yourself or through a custodian. This can be risky, as there are few buyers for uranium, and its price can be volatile. Storing uranium safely can also be complicated and expensive because it's highly radioactive.

How to Invest in Pipelines and Oil Refining 

Pipelines provide infrastructure for transporting oil and gas, and refining converts crude oil into gasoline and diesel. Pipeline investments typically come in two forms: master limited partnerships (MLPs) or ETFs. MLPs offer a share of profits generated by the pipeline network and often have attractive dividends. Of course, always consider the companies' safety records, environmental practices and regulatory environment.

How to Invest in Renewable Energy

Investing in renewable energy is an environmentally friendly alternative to fossil fuels and an effective way to reduce your carbon footprint. You can invest directly in stocks of companies involved with the industry. ETFs such as iShares Global Clean Energy ETF (NYSEARCA: ICLN) and Invesco Solar ETF (NYSEARCA: TAN) can also offer you exposure.

Pros and Cons of Investing in Energy 

Investing in energy can significantly diversify your portfolio and capitalize on the growing demand for energy worldwide. However, there are some potential risks.

Pros 

Check out the potential benefits of investing in energy:

  • Diversification: Energy investments can hedge against market volatility, reducing overall portfolio risk.
  • High returns: The best energy stocks have historically produced higher returns than the broader stock market.
  • Predictable cash flows: Oil and gas companies often have long-term contracts with customers that provide stability and predictable cash flows.
  • Tax benefits: Oil and gas companies may be eligible for various tax benefits, including depletion allowances, research and development expense deductions and intangible drilling costs.

Cons 

The downsides of investing in energy, on the other hand, can include the following: 

  • Volatile prices: The price of oil and natural gas is subject to supply and demand pressures, causing large swings, sometimes resulting in significant losses in the short term.
  • Political risks: Changes in government policies, regulations or taxes can impact profits.
  • Environmental concerns: Oil and gas companies carry environmental risks due to fracking or offshore drilling. Rigorous safety standards can help protect against these risks.

Future of Energy 

The future for energy stocks and other investments is constantly changing due to new technologies. Wind, solar and hydropower are catching on as clean and reliable sources of power, and advances in battery technology have made it more feasible to store energy for later use. Advances in carbon capture technology can help reduce emissions from fossil fuels and make them more efficient.

Keep the Lights on in Your Portfolio

Investing in energy can be lucrative. It can help diversify your portfolio and give you a stake in the growing global demand for energy. If you're looking for energy stocks to buy, remember that stocks, ETFs and renewable energy projects can offer possible high returns, predictable cash flows and tax benefits. However, they also carry volatile prices and political risks. As the world works to reduce carbon emissions, investment in renewable energy sources will remain attractive as long-term investments.

FAQs 

Below are some of the most frequently asked questions you might still have about investing in energy:

Are energy stocks a good investment?

A good energy stock can offer potentially high returns, predictable cash flows and certain tax benefits. However, they also come with volatility due to price changes and political risks. Always carefully research the company's fundamentals and diversify by sector, geography and fuel type.

What is the best way to invest in energy? 

The best way to invest in energy depends on your individual investment goals. Direct investments such as stocks, ETFs and mutual funds offer more control and potential for higher returns, while renewable energy projects provide the chance to support environmentally friendly technologies.

Are energy stocks good in a recession? 

Top energy stocks can be a good investment in a recession as they tend to be insulated from market downturns and often are countercyclical, which means they can often rise even in a downturn. However, practice due diligence and be mindful of their potential volatility.

My Account -