QQQ   337.27 (+1.86%)
AAPL   175.05 (+1.37%)
MSFT   318.52 (+1.44%)
META   246.85 (+1.80%)
GOOGL   122.83 (+1.65%)
AMZN   118.15 (+2.29%)
TSLA   176.89 (+1.74%)
NVDA   316.78 (+4.97%)
NIO   7.82 (-2.62%)
BABA   85.77 (-5.41%)
AMD   107.93 (+4.03%)
T   16.55 (-0.66%)
F   11.64 (+1.22%)
MU   67.57 (+4.08%)
CGC   1.05 (+0.00%)
GE   104.01 (+0.52%)
DIS   93.76 (+1.07%)
AMC   5.07 (-0.59%)
PFE   36.48 (-0.73%)
PYPL   61.27 (-0.31%)
NFLX   371.29 (+9.22%)

Dow 30 Stocks List

Compare dow 30 stocks and their fundamentals, performance, price, and technicals. Use this free stock comparison tool to evaluate companies based on their analyst ratings, book value, debt, dividend, MarketRank, news sentiment, price performance, profitability, and more. Enter up to ten stock symbols separated by a comma or space (ex. BAC, JPM, WFC, C, GS).

Learn more about trading DOW stocks.

Compare Stocks - Price & Volume

CompanyCurrent Price50-Day Moving Average52-Week RangeMarket CapBetaAvg. VolumeToday's Volume
Apple Inc. stock logo
AAPL
Apple
$175.05
+1.4%
$163.82
$124.17
$176.15
$2.75 T1.2963.73 million shs65.09 million shs
Amgen Inc. stock logo
AMGN
Amgen
$224.23
-0.4%
$239.07
$220.44
$296.67
$119.81 B0.642.34 million shs2.23 million shs
Cisco Systems, Inc. stock logo
CSCO
Cisco Systems
$48.20
+1.2%
$48.92
$38.60
$52.56
$197.42 B118.41 million shs41.16 million shs
Honeywell International Inc. stock logo
HON
Honeywell International
$198.25
+1.1%
$193.89
$166.63
$220.96
$131.97 B1.092.93 million shs2.42 million shs
Intel Co. stock logo
INTC
Intel
$29.68
+2.8%
$30.31
$24.59
$44.93
$123.80 B0.8843.62 million shs36.41 million shs
Microsoft Co. stock logo
MSFT
Microsoft
$318.52
+1.4%
$288.14
$213.43
$319.04
$2.37 T0.9330.73 million shs26.37 million shs
Walgreens Boots Alliance, Inc. stock logo
WBA
Walgreens Boots Alliance
$31.46
-0.3%
$33.88
$30.39
$44.27
$27.14 B0.716.87 million shs6.53 million shs
American Express stock logo
AXP
American Express
$153.48
+0.9%
$159.02
$130.65
$182.15
$114.07 B1.183.46 million shs2.35 million shs
The Boeing Company stock logo
BA
Boeing
$207.24
+0.2%
$204.86
$113.02
$221.33
$124.67 B1.435.96 million shs4.34 million shs
Caterpillar Inc. stock logo
CAT
Caterpillar
$214.72
+1.2%
$218.82
$160.60
$266.04
$110.66 B1.093.26 million shs2.60 million shs

Price Performance

Company1-Day Performance7-Day Performance30-Day Performance90-Day Performance1-Year Performance
Apple Inc. stock logo
AAPL
Apple
+0.36%-0.50%+4.51%+12.35%+15.71%
Amgen Inc. stock logo
AMGN
Amgen
-1.26%-3.88%-9.29%-3.93%-8.29%
Cisco Systems, Inc. stock logo
CSCO
Cisco Systems
+1.51%+1.97%-5.27%-6.59%-5.87%
Honeywell International Inc. stock logo
HON
Honeywell International
+2.30%-0.67%-0.93%-1.68%-1.53%
Intel Co. stock logo
INTC
Intel
-1.20%-3.67%-10.17%+2.38%-34.98%
Microsoft Co. stock logo
MSFT
Microsoft
+0.72%+0.54%+8.73%+19.78%+17.68%
Walgreens Boots Alliance, Inc. stock logo
WBA
Walgreens Boots Alliance
+2.20%+1.42%-10.85%-11.78%-28.70%
American Express stock logo
AXP
American Express
+2.48%+2.29%-7.10%-14.53%-6.03%
The Boeing Company stock logo
BA
Boeing
+2.99%+3.00%+0.90%-2.52%+56.66%
Caterpillar Inc. stock logo
CAT
Caterpillar
+2.36%-0.50%-5.83%-13.96%-0.46%

MarketRank™

CompanyOverall ScoreAnalyst's OpinionShort Interest ScoreDividend StrengthESG ScoreNews and Social Media SentimentCompany OwnershipEarnings & Valuation
Apple Inc. stock logo
AAPL
Apple
2.5254 of 5 stars
2.43.03.32.72.51.72.5
Amgen Inc. stock logo
AMGN
Amgen
2.6709 of 5 stars
2.14.05.03.92.11.71.9
Cisco Systems, Inc. stock logo
CSCO
Cisco Systems
2.7437 of 5 stars
2.33.04.23.62.42.52.5
Honeywell International Inc. stock logo
HON
Honeywell International
2.0859 of 5 stars
1.20.04.21.73.02.51.9
Intel Co. stock logo
INTC
Intel
2.2654 of 5 stars
2.05.01.72.51.32.51.9
Microsoft Co. stock logo
MSFT
Microsoft
2.6488 of 5 stars
2.43.03.32.92.52.52.5
Walgreens Boots Alliance, Inc. stock logo
WBA
Walgreens Boots Alliance
2.8984 of 5 stars
4.12.04.22.32.33.31.3
American Express stock logo
AXP
American Express
2.972 of 5 stars
3.13.02.53.02.02.53.8
The Boeing Company stock logo
BA
Boeing
1.3697 of 5 stars
1.35.00.00.01.81.70.6
Caterpillar Inc. stock logo
CAT
Caterpillar
2.5297 of 5 stars
2.15.04.21.33.11.71.9

Analyst Ratings

CompanyConsensus Rating ScoreConsensus RatingConsensus Price Target% Upside from Current Price
Apple Inc. stock logo
AAPL
Apple
2.76
Moderate Buy$174.73-0.18% Downside
Amgen Inc. stock logo
AMGN
Amgen
2.15
Hold$250.9411.91% Upside
Cisco Systems, Inc. stock logo
CSCO
Cisco Systems
2.50
Moderate Buy$56.5717.37% Upside
Honeywell International Inc. stock logo
HON
Honeywell International
2.43
Hold$214.568.23% Upside
Intel Co. stock logo
INTC
Intel
1.97
Hold$31.526.19% Upside
Microsoft Co. stock logo
MSFT
Microsoft
2.83
Moderate Buy$323.281.50% Upside
Walgreens Boots Alliance, Inc. stock logo
WBA
Walgreens Boots Alliance
2.23
Hold$42.4634.97% Upside
American Express stock logo
AXP
American Express
2.18
Hold$177.4115.59% Upside
The Boeing Company stock logo
BA
Boeing
2.63
Moderate Buy$221.606.93% Upside
Caterpillar Inc. stock logo
CAT
Caterpillar
2.25
Hold$238.9411.28% Upside

Current Analyst Ratings

Latest Dow 30 Stocks Analyst Ratings

DateCompanyBrokerageActionRatingPrice TargetDetails
5/18/2023
Cisco Systems, Inc. stock logo
CSCO
Cisco Systems
Piper Sandler
Subscribe to MarketBeat All Access for the recommendation accuracy rating
Lower Price Target$53.00 ➝ $51.00
5/18/2023
Cisco Systems, Inc. stock logo
CSCO
Cisco Systems
Raymond James
Subscribe to MarketBeat All Access for the recommendation accuracy rating
Boost Price Target$63.00 ➝ $64.00
5/18/2023
Cisco Systems, Inc. stock logo
CSCO
Cisco Systems
Barclays
Subscribe to MarketBeat All Access for the recommendation accuracy rating
Lower Price Target$52.00 ➝ $51.00
5/17/2023
Apple Inc. stock logo
AAPL
Apple
Fundamental Research
Subscribe to MarketBeat All Access for the recommendation accuracy rating
Set Price TargetBuy$183.86
5/11/2023
Microsoft Co. stock logo
MSFT
Microsoft
Wedbush
Subscribe to MarketBeat All Access for the recommendation accuracy rating
Boost Price Target$325.00 ➝ $340.00
5/9/2023
Caterpillar Inc. stock logo
CAT
Caterpillar
Evercore ISI
Subscribe to MarketBeat All Access for the recommendation accuracy rating
Lower Price Target$288.00 ➝ $263.00
5/8/2023
Caterpillar Inc. stock logo
CAT
Caterpillar
Robert W. Baird
Subscribe to MarketBeat All Access for the recommendation accuracy rating
Lower Price Target$185.00 ➝ $180.00
5/5/2023
Apple Inc. stock logo
AAPL
Apple
Bank of America
Subscribe to MarketBeat All Access for the recommendation accuracy rating
Boost Price TargetNeutral$173.00 ➝ $176.00
5/5/2023
Apple Inc. stock logo
AAPL
Apple
Canaccord Genuity Group
Subscribe to MarketBeat All Access for the recommendation accuracy rating
Boost Price TargetBuy$180.00 ➝ $185.00
5/5/2023
Apple Inc. stock logo
AAPL
Apple
Monness Crespi & Hardt
Subscribe to MarketBeat All Access for the recommendation accuracy rating
Boost Price TargetBuy$174.00 ➝ $188.00
5/5/2023
Apple Inc. stock logo
AAPL
Apple
DA Davidson
Subscribe to MarketBeat All Access for the recommendation accuracy rating
Boost Price TargetBuy$173.00 ➝ $193.00
(Data available from 5/18/2020 forward. View 10+ years of historical ratings with our analyst ratings screener.)

Sales & Book Value

CompanyAnnual RevenuePrice/SalesCashflowPrice/CashBook ValuePrice/Book
Apple Inc. stock logo
AAPL
Apple
$394.33B6.98$7.09 per share24.68$3.95 per share44.32
Amgen Inc. stock logo
AMGN
Amgen
$26.32B4.55$23.96 per share9.36$10.01 per share22.40
Cisco Systems, Inc. stock logo
CSCO
Cisco Systems
$51.56B3.83$3.60 per share13.38$9.60 per share5.02
Honeywell International Inc. stock logo
HON
Honeywell International
$35.95B3.67$11.13 per share17.81$26.31 per share7.54
Intel Co. stock logo
INTC
Intel
$63.05B1.96$5.06 per share5.86$24.07 per share1.23
Microsoft Co. stock logo
MSFT
Microsoft
$198.27B11.95$11.49 per share27.71$26.18 per share12.17
Walgreens Boots Alliance, Inc. stock logo
WBA
Walgreens Boots Alliance
$132.70B0.20$7.37 per share4.27$33.98 per share0.93
American Express stock logo
AXP
American Express
$52.86B2.16$12.65 per share12.13$34.97 per share4.39
The Boeing Company stock logo
BA
Boeing
$66.61B1.87N/AN/A($25.74) per share-8.05
Caterpillar Inc. stock logo
CAT
Caterpillar
$59.43B1.86$21.03 per share10.21$35.26 per share6.09

Profitability & Earnings

CompanyNet IncomeEPSTrailing P/E RatioForward P/E RatioP/E GrowthNet MarginsReturn on Equity (ROE)Return on Assets (ROA)Next Earnings Date
Apple Inc. stock logo
AAPL
Apple
$99.80B$5.8929.7226.362.3024.49%165.72%27.58%7/27/2023 (Estimated)
Amgen Inc. stock logo
AMGN
Amgen
$6.55B$14.7115.2411.611.8030.23%248.47%13.54%8/3/2023 (Estimated)
Cisco Systems, Inc. stock logo
CSCO
Cisco Systems
$11.81B$2.7317.6613.432.1621.26%31.19%13.44%8/16/2023 (Estimated)
Honeywell International Inc. stock logo
HON
Honeywell International
$4.97B$7.7025.7519.772.2814.53%34.01%9.92%7/27/2023 (Estimated)
Intel Co. stock logo
INTC
Intel
$8.01B-$0.68N/A16.6714.63-5.06%3.06%1.74%7/27/2023 (Estimated)
Microsoft Co. stock logo
MSFT
Microsoft
$72.74B$9.2334.5129.552.7733.25%38.98%19.05%7/25/2023 (Estimated)
Walgreens Boots Alliance, Inc. stock logo
WBA
Walgreens Boots Alliance
$4.34B-$3.65N/A6.602.30-2.36%12.42%3.76%6/29/2023 (Estimated)
American Express stock logo
AXP
American Express
$7.51B$9.5116.1412.170.9213.00%29.44%3.26%7/28/2023 (Estimated)
The Boeing Company stock logo
BA
Boeing
-$4.94B-$6.92N/A36.42N/A-5.86%N/A-4.18%7/26/2023 (Estimated)
Caterpillar Inc. stock logo
CAT
Caterpillar
$6.71B$13.5315.8712.020.9911.52%50.98%10.18%8/1/2023 (Estimated)

Latest Dow 30 Stocks Earnings

DateQuarterCompanyConsensus EstimateReported EPSBeat/MissGap EPSRevenue EstimateActual RevenueDetails
5/17/2023Q3 23
Cisco Systems, Inc. stock logo
CSCO
Cisco Systems
$0.97$1.00+$0.03$0.98$14.36 billion$14.57 billion    
5/4/2023Q2 2023
Apple Inc. stock logo
AAPL
Apple
$1.44$1.52+$0.08$1.52$92.84 billion$94.84 billion    
4/27/2023Q1 2023
Amgen Inc. stock logo
AMGN
Amgen
$3.84$3.98+$0.14$2.68$6.18 billion$6.11 billion    
4/27/2023Q1 2023
Honeywell International Inc. stock logo
HON
Honeywell International
$1.93$2.07+$0.14$2.07$8.51 billion$8.86 billion      
4/27/2023Q1 23
Intel Co. stock logo
INTC
Intel
-$0.16-$0.04+$0.12$0.24$11.13 billion$11.72 billion    
4/27/2023Q1 23
Caterpillar Inc. stock logo
CAT
Caterpillar
$3.79$4.91+$1.12$6.08$15.27 billion$15.86 billion      
4/26/2023Q1 2023
The Boeing Company stock logo
BA
Boeing
-$0.98-$1.27-$0.29-$1.85$17.56 billion$17.92 billion      
4/25/2023Q3 2023
Microsoft Co. stock logo
MSFT
Microsoft
$2.22$2.45+$0.23$2.45$51.01 billion$52.86 billion    
4/20/2023Q1 23
American Express stock logo
AXP
American Express
$2.66$2.40-$0.26$2.40$14.02 billion$14.28 billion      
3/28/2023Q2 23
Walgreens Boots Alliance, Inc. stock logo
WBA
Walgreens Boots Alliance
$1.10$1.16+$0.06$1.51$33.56 billion$34.86 billion    

Dividends

CompanyAnnual PayoutDividend Yield3-Year Dividend GrowthPayout RatioYears of Consecutive Growth
Apple Inc. stock logo
AAPL
Apple
$0.960.55%+6.19%16.30%12 Years
Amgen Inc. stock logo
AMGN
Amgen
$8.523.80%+10.14%57.92%11 Years
Cisco Systems, Inc. stock logo
CSCO
Cisco Systems
$1.563.24%+2.78%57.14%13 Years
Honeywell International Inc. stock logo
HON
Honeywell International
$4.122.08%+5.72%53.51%12 Years
Intel Co. stock logo
INTC
Intel
$0.501.68%+5.03%N/A N/A
Microsoft Co. stock logo
MSFT
Microsoft
$2.720.85%+10.25%29.47%20 Years
Walgreens Boots Alliance, Inc. stock logo
WBA
Walgreens Boots Alliance
$1.926.10%+2.18%N/A 47 Years
American Express stock logo
AXP
American Express
$2.401.56%+8.24%25.24%2 Years
The Boeing Company stock logo
BA
Boeing
N/AN/AN/AN/AN/A
Caterpillar Inc. stock logo
CAT
Caterpillar
$4.802.24%+6.04%35.48%30 Years

Latest Dow 30 Stocks Dividends

AnnouncementCompanyPeriodAmountYieldEx-Dividend DateRecord DatePayable Date
5/3/2023
American Express stock logo
AXP
American Express
quarterly$0.601.58%7/6/20237/7/20238/10/2023
5/17/2023
Cisco Systems, Inc. stock logo
CSCO
Cisco Systems
quarterly$0.393.28%7/6/20237/26/2023
4/20/2023
Walgreens Boots Alliance, Inc. stock logo
WBA
Walgreens Boots Alliance
quarterly$0.485.42%5/18/20235/19/20236/12/2023
3/7/2023
Amgen Inc. stock logo
AMGN
Amgen
quarterly$2.133.73%5/17/20235/18/20236/8/2023
3/14/2023
Microsoft Co. stock logo
MSFT
Microsoft
quarterly$0.681.04%5/17/20235/18/20236/8/2023
4/24/2023
Honeywell International Inc. stock logo
HON
Honeywell International
quarterly$1.032.09%5/11/20235/12/20236/2/2023
2/22/2023
Intel Co. stock logo
INTC
Intel
Quarterly$0.12501.96%5/4/20235/7/20236/1/2023
4/12/2023
Caterpillar Inc. stock logo
CAT
Caterpillar
quarterly$1.202.16%4/21/20234/24/20235/19/2023
5/4/2023
Apple Inc. stock logo
AAPL
Apple
quarterly$0.240.58%5/12/20235/15/20235/18/2023
3/8/2023
American Express stock logo
AXP
American Express
quarterly$0.601.37%4/5/20234/7/20235/10/2023
(Data available from 1/1/2013 forward)

Debt

CompanyDebt-to-Equity RatioCurrent RatioQuick Ratio
Apple Inc. stock logo
AAPL
Apple
1.56
0.94
0.88
Amgen Inc. stock logo
AMGN
Amgen
11.36
3.14
2.79
Cisco Systems, Inc. stock logo
CSCO
Cisco Systems
0.18
1.41
1.30
Honeywell International Inc. stock logo
HON
Honeywell International
0.84
1.26
0.94
Intel Co. stock logo
INTC
Intel
0.49
1.76
1.29
Microsoft Co. stock logo
MSFT
Microsoft
0.22
1.91
1.88
Walgreens Boots Alliance, Inc. stock logo
WBA
Walgreens Boots Alliance
0.30
0.63
0.32
American Express stock logo
AXP
American Express
1.58
1.55
1.55
The Boeing Company stock logo
BA
Boeing
N/A
1.16
0.32
Caterpillar Inc. stock logo
CAT
Caterpillar
1.37
1.43
0.88

Ownership

Institutional Ownership

CompanyInstitutional Ownership
Apple Inc. stock logo
AAPL
Apple
57.60%
Amgen Inc. stock logo
AMGN
Amgen
75.53%
Cisco Systems, Inc. stock logo
CSCO
Cisco Systems
71.10%
Honeywell International Inc. stock logo
HON
Honeywell International
74.30%
Intel Co. stock logo
INTC
Intel
59.48%
Microsoft Co. stock logo
MSFT
Microsoft
69.15%
Walgreens Boots Alliance, Inc. stock logo
WBA
Walgreens Boots Alliance
56.71%
American Express stock logo
AXP
American Express
83.30%
The Boeing Company stock logo
BA
Boeing
57.07%
Caterpillar Inc. stock logo
CAT
Caterpillar
68.02%

Miscellaneous

CompanyEmployeesShares OutstandingFree FloatOptionable
Apple Inc. stock logo
AAPL
Apple
164,00015.73 billion15.72 billionOptionable
Amgen Inc. stock logo
AMGN
Amgen
25,200534.33 million531.28 millionOptionable
Cisco Systems, Inc. stock logo
CSCO
Cisco Systems
26,0004.10 billion4.10 billionOptionable
Honeywell International Inc. stock logo
HON
Honeywell International
97,000665.68 million662.82 millionOptionable
Intel Co. stock logo
INTC
Intel
131,9004.17 billion4.17 billionOptionable
Microsoft Co. stock logo
MSFT
Microsoft
221,0007.44 billion7.43 billionOptionable
Walgreens Boots Alliance, Inc. stock logo
WBA
Walgreens Boots Alliance
325,000862.80 million712.67 millionOptionable
American Express stock logo
AXP
American Express
77,300743.24 million742.35 millionOptionable
The Boeing Company stock logo
BA
Boeing
156,000601.59 million600.69 millionOptionable
Caterpillar Inc. stock logo
CAT
Caterpillar
109,100515.36 million513.97 millionOptionable

Dow 30 Stocks Headlines

SourceHeadline
Norway Will Transfer 3 Radars And Up To 8 M270 Systems To Ukraine. It Is Caterpillar Counterpart To HIMARSNorway Will Transfer 3 Radars And Up To 8 M270 Systems To Ukraine. It Is Caterpillar Counterpart To HIMARS
ukranews.com - May 18 at 6:42 PM
Caterpillar Chairman & CEO Jim Umpleby to Participate in a Fireside Chat at Bernstein’s 39th Annual ConferenceCaterpillar Chairman & CEO Jim Umpleby to Participate in a Fireside Chat at Bernstein’s 39th Annual Conference
caterpillar.com - May 18 at 1:42 PM
Caterpillar (NYSE:CAT) Coverage Initiated by Analysts at StockNews.comCaterpillar (NYSE:CAT) Coverage Initiated by Analysts at StockNews.com
marketbeat.com - May 18 at 3:46 AM
Peering Into Caterpillars Recent Short InterestPeering Into Caterpillar's Recent Short Interest
msn.com - May 17 at 3:08 PM
Financial Partners Group LLC Invests $6.30 Million in Caterpillar Inc. (NYSE:CAT)Financial Partners Group LLC Invests $6.30 Million in Caterpillar Inc. (NYSE:CAT)
marketbeat.com - May 17 at 11:48 AM
Vibratory Soil Compactor Market Consumption, Supply, Demand, Segments, and Forecast 2023-2029 – WIRTGEN, Caterpillar, BomagVibratory Soil Compactor Market Consumption, Supply, Demand, Segments, and Forecast 2023-2029 – WIRTGEN, Caterpillar, Bomag
marketwatch.com - May 17 at 10:08 AM
3 Stocks Backed by High Efficiency to Boost Portfolio Returns3 Stocks Backed by High Efficiency to Boost Portfolio Returns
finance.yahoo.com - May 17 at 10:08 AM
Remote Construction Market Size, Application,Growth, Geographic Scope and Forecast to 2030|Oracle Corporation, Autodesk, Trimble, CaterpillarRemote Construction Market Size, Application,Growth, Geographic Scope and Forecast to 2030|Oracle Corporation, Autodesk, Trimble, Caterpillar
marketwatch.com - May 17 at 1:01 AM
Keira Walsh, Georgia Stanway & caterpillar cakeKeira Walsh, Georgia Stanway & caterpillar cake
bbc.co.uk - May 17 at 1:01 AM
Earthmoving Solution Market 2023 Size, Status and Business Outlook 2030| Caterpillar, XCMG Group, Queensland, Duplomatic GroupEarthmoving Solution Market 2023 Size, Status and Business Outlook 2030| Caterpillar, XCMG Group, Queensland, Duplomatic Group
marketwatch.com - May 16 at 3:00 PM
Mini Track Loaders Market Growing Demand for Business Development 2023 – John Deere,Caterpillar,Gehl CompanyMini Track Loaders Market Growing Demand for Business Development 2023 – John Deere,Caterpillar,Gehl Company
marketwatch.com - May 16 at 9:59 AM
Research Analysts Offer Predictions for Caterpillar Inc.s Q2 2023 Earnings (NYSE:CAT)Research Analysts Offer Predictions for Caterpillar Inc.'s Q2 2023 Earnings (NYSE:CAT)
americanbankingnews.com - May 16 at 2:30 AM
Earthmoving Solution Market Size and Analysis By 2023 to 2030 |Caterpillar, XCMG Group QueenslandEarthmoving Solution Market Size and Analysis By 2023 to 2030 |Caterpillar, XCMG Group Queensland
marketwatch.com - May 16 at 12:40 AM
Engineers &Planners, Mansour Group sign $230m Caterpillar equipment financing agreementEngineers &Planners, Mansour Group sign $230m Caterpillar equipment financing agreement
msn.com - May 15 at 7:40 PM
Ibrahim Mahama’s E&P and Mansour Group sign $230m Caterpillar equipment financing dealIbrahim Mahama’s E&P and Mansour Group sign $230m Caterpillar equipment financing deal
myjoyonline.com - May 15 at 7:40 PM
Commercial Backup Power Market Overview 2023 to 2030, Future Trends and Forecast | Cummins, Perkins, CaterpillarCommercial Backup Power Market Overview 2023 to 2030, Future Trends and Forecast | Cummins, Perkins, Caterpillar
marketwatch.com - May 15 at 2:39 PM
Intel, Caterpillar share gains lead Dows 100-point jumpIntel, Caterpillar share gains lead Dow's 100-point jump
msn.com - May 15 at 2:39 PM
Construction and Engineering Project Management Market Seeking Excellent Growth with Oracle Corporation, Autodesk, Trimble, CaterpillarConstruction and Engineering Project Management Market Seeking Excellent Growth with Oracle Corporation, Autodesk, Trimble, Caterpillar
marketwatch.com - May 15 at 9:38 AM
I’m a doctor – here’s what it means if your poo looks like a caterpillar… and the food item it SHOULD look likeI’m a doctor – here’s what it means if your poo looks like a caterpillar… and the food item it SHOULD look like
thesun.co.uk - May 15 at 9:38 AM
Q2 2023 Earnings Forecast for Caterpillar Inc. Issued By Zacks Research (NYSE:CAT)Q2 2023 Earnings Forecast for Caterpillar Inc. Issued By Zacks Research (NYSE:CAT)
marketbeat.com - May 15 at 2:22 AM
Public warned over caterpillar that must not be touched under any circumstancesPublic warned over caterpillar that must not be touched 'under any circumstances'
express.co.uk - May 14 at 7:31 PM
I didn’t want to buy an expensive birthday cake for my daughter so made a budget caterpillar and it looks so goodI didn’t want to buy an expensive birthday cake for my daughter so made a budget caterpillar and it looks so good
thesun.ie - May 14 at 2:30 PM
Mum praised for making budget caterpillar cake for daughters 5th birthdayMum praised for making budget caterpillar cake for daughter's 5th birthday
mirror.co.uk - May 14 at 2:30 PM
Caterpillar enthusiasts show off tractors, history at Kids Day - Fairfield Daily RepublicCaterpillar enthusiasts show off tractors, history at Kids Day - Fairfield Daily Republic
news.google.com - May 14 at 4:29 AM

New MarketBeat Followers Over Time

Media Sentiment Over Time

Top Headlines

All Headlines

Company Descriptions

Apple logo

Apple

NASDAQ:AAPL
Apple, Inc. engages in the design, manufacture, and sale of smartphones, personal computers, tablets, wearables and accessories, and other varieties of related services. It operates through the following geographical segments: Americas, Europe, Greater China, Japan, and Rest of Asia Pacific. The Americas segment includes North and South America. The Europe segment consists of European countries, as well as India, the Middle East, and Africa. The Greater China segment comprises China, Hong Kong, and Taiwan. The Rest of Asia Pacific segment includes Australia and Asian countries. Its products and services include iPhone, Mac, iPad, AirPods, Apple TV, Apple Watch, Beats products, AppleCare, iCloud, digital content stores, streaming, and licensing services. The company was founded by Steven Paul Jobs, Ronald Gerald Wayne, and Stephen G. Wozniak in April 1976 and is headquartered in Cupertino, CA.
Amgen logo

Amgen

NASDAQ:AMGN
Amgen, Inc. is a biotechnology company, which engages in the discovery, development, manufacture, and marketing of human therapeutics. It operates through Human Therapeutics segment. The company was founded by William K. Bowes, Jr., Franklin Pitcher Johnson, Jr., George B. Rathmann, and Joseph Rubinfeld on April 8, 1980 and is headquartered in Thousand Oaks, CA.
Cisco Systems logo

Cisco Systems

NASDAQ:CSCO
Cisco Systems, Inc. engages in the design, manufacture, and sale of Internet Protocol-based networking products and services related to the communications and information technology industry. The firm operates through the following geographical segments: the Americas, EMEA, and APJC. Its products include the following categories: Switches, Routers, Wireless, Network Management Interfaces and Modules, Optical Networking, Access Points, Outdoor and Industrial Access Points, Next-Generation Firewalls, Advanced Malware Protection, VPN Security Clients, Email, and Web Security. The company was founded by Sandra Lerner and Leonard Bosack on December 10, 1984 and is headquartered in San Jose, CA.
Honeywell International logo

Honeywell International

NASDAQ:HON
Honeywell International, Inc. is a software industrial company, which offers industry specific solutions to aerospace and automotive products and services. It specializes in turbochargers control, sensing and security technologies for buildings and homes, specialty chemicals, electronic and advanced materials, process technology for refining and petrochemicals, and energy efficient products and solutions for homes, business, and transportation. It operates through the following segments: Aerospace, Home and Building Technologies, Performance Materials and Technologies, and Safety and Productivity Solutions. The company was founded by Albert M. Butz in 1906 and is headquartered in Charlotte, NC.
Intel logo

Intel

NASDAQ:INTC
Intel Corp. engages in the design, manufacture, and sale of computer products and technologies. It delivers computer, networking, data storage, and communications platforms. The firm operates through the following segments: Client Computing Group (CCG), Data Center and AI (DCAI), Network and Edge (NEX), Mobileye, Accelerated Computing Systems and Graphics (AXG), Intel Foundry Services (IFS), and All Other. The CCG segment consists of platforms designed for notebooks, 2-in-1 systems, desktops, tablets, phones, wireless and wired connectivity products, and mobile communication components. The DCAI segment delivers solutions to cloud service providers and enterprise customers, along with silicon devices for communications service providers and high-performance computing customers. The NEX segment offers computing system solutions from inflexible fixed-function hardware to general-purpose compute, acceleration, and networking devices running cloud native software on programmable hardware. The Mobileye segment develops driving assistance and self-driving solutions. The AXG segment provides products and technologies designed to help customers solve the toughest computational problems. It
Microsoft logo

Microsoft

NASDAQ:MSFT
Microsoft Corp. engages in the development and support of software, services, devices, and solutions. It operates through the following business segments: Productivity and Business Processes, Intelligent Cloud, and More Personal Computing. The Productivity and Business Processes segment consists of Office Commercial (Office 365 subscriptions, the Office 365 portion of Microsoft 365 Commercial subscriptions, and Office licensed on-premises), Exchange, SharePoint, Microsoft Teams, Office 365 Security and Compliance, and Skype for Business, Office Consumer, including Microsoft 365 Consumer subscriptions, Office licensed on-premises, and other Office services, LinkedIn, including Talent Solutions, Marketing Solutions, Premium Subscriptions, Sales Solutions, and Learning Solutions, Dynamics business solutions, including Dynamics 365, comprising a set of intelligent, cloud-based applications across ERP, CRM, Customer Insights, Power Apps, and Power Automate, and on-premises ERP and CRM applications. The Intelligent Cloud segment consists of Server products and cloud services, including Azure and other cloud services, SQL Server, Windows Server, Visual Studio, System Center, and related C
Walgreens Boots Alliance logo

Walgreens Boots Alliance

NASDAQ:WBA
Walgreens Boots Alliance, Inc. engages in the provision of healthcare and retail pharmacy services. It operates through the following segments: United States Retail Pharmacy, International, and United States Healthcare. The US Retail Pharmacy segment includes the operation of retail drugstores, health and wellness services, specialty and home delivery pharmacy services, and equity method investment. The International segment offers pharmacy-led health and beauty retail businesses outside the US and the pharmaceutical wholesaling and distribution business in Germany. The US Healthcare segment delivers improved health outcomes and lower costs for payors and providers through owned and partnered assets. The company was founded by Charles R. Walgreen and John Boot in 1901 and is headquartered in Deerfield, IL.
American Express logo

American Express

NYSE:AXP
American Express Co. engages in the provision of charge and credit card products and travel-related services. It operates through the following segments: U.S Consumer Services (USCS), Commercial Services (CS), International Card Services (ICS), Global Merchant and Network Services (GMNS), and Corporate and Other. The USCS segment issues a wide range of proprietary consumer cards to U.S consumers. The CS segment offers proprietary corporate and small business cards and provides services to U.S. businesses, including payment and expense management, banking and non-card financing products. The ICS segment focuses on a range of proprietary consumer, small business and corporate cards outside the United States. It also provides services to international customers, including travel and lifestyle services, and manages certain international joint ventures and loyalty coalition businesses. The GMNS segment operates a global payments network that processes and settles card transactions, acquires merchants, and provides multi-channel marketing programs and capabilities, services, and data analytics. The Corporate and Other segment covers corporate functions and certain other businesses and op
Boeing logo

Boeing

NYSE:BA
The Boeing Co. is an aerospace company, which engages in the manufacture of commercial jetliners and defense, space, and security systems. It operates through the following segments: Commercial Airplanes (BCA), Defense, Space and Security (BDS), Global Services (BGS), and Boeing Capital (BCC). The Commercial Airplanes segment includes the development, production, and market of commercial jet aircraft and provides fleet support services, principally to the commercial airline industry worldwide. The Defense, Space and Security segment refers to the research, development, production and modification of manned and unmanned military aircraft and weapons systems for global strike, including fighter and combat rotorcraft aircraft and missile systems, global mobility, including tanker, rotorcraft and tilt-rotor aircraft, and airborne surveillance and reconnaissance, including command and control, battle management and airborne anti-submarine aircraft. The Global Services segment provides services to commercial and defense customers. The Boeing Capital segment seeks to ensure that Boeing customers have the financing they need to buy and take delivery of their Boeing product and manages over
Caterpillar logo

Caterpillar

NYSE:CAT
Caterpillar, Inc. engages in the manufacture of construction and mining equipment, diesel and natural gas engines, industrial gas turbines, and diesel-electric locomotives. It operates through the following segments: Construction Industries, Resource Industries, Energy and Transportation, Financial Products, and All Other. The Construction Industries segment supports customers using machinery in infrastructure and building construction applications. The Resource Industries segment is responsible for supporting customers using machinery in mining and quarrying applications and it includes business strategy, product design, product management and development, manufacturing, marketing, and sales and product support. The Energy and Transportation segment supports customers in oil and gas, power generation, marine, rail, and industrial applications. The Financial Products segment offers a range of financing alternatives to customers and dealers for caterpillar machinery and engines, solar gas turbines, as well as other equipment and marine vessels. The All Other segment includes activities such as the business strategy, product management and development, and manufacturing of filters an

Key Points

  • The Dow Jones Industrial Average (DJIA) represents a weighted performance of 30 of the largest companies in the United States. 
  • To invest in the DJIA, investors may buy and sell individual shares of stock or ETFs that encompass the entirety of the index. 
  • Learn more about the DJIA and how DIJA stocks vary from stocks included in other indexes.

Like most investors, you've probably heard some chatter about stocks in the Dow, how prices are changing and how these prices impact the economy. But what exactly is the Dow Jones Industrial Average (DIJA), and how do DIJA stocks vary from stocks included in other indexes?

The Dow is a stock index that tracks the performance of 30 large, publicly traded companies listed on stock exchanges in the United States. Stocks in the Dow Jones represent major consumer goods companies, many of which you'll recognize as everyday products. Read on to learn more about what stocks are in the Dow and how you can invest in other major indexes. 

Overview of Companies in the Dow

The DJIA is a stock market index designed to quickly measure the overall health of the American economy, similar to other major indexes. You can view an overview of market indexes on MarketBeat to learn more about the importance of indexes and the function they serve in the economy.

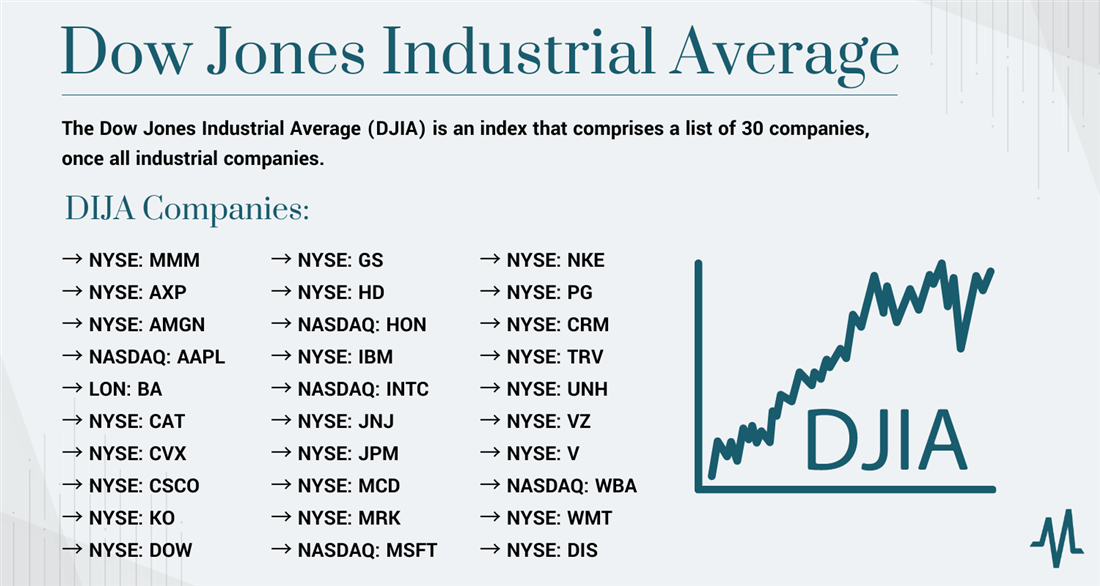
How many stocks are in the Dow Jones Industrial Average? The Dow currently includes 30 of the largest stocks in the country, which has been the set number of stocks in DIJA since 1928. While the number of stocks on the Dow has fluctuated over time, the number of included companies will remain at 30 for the foreseeable future.

What stocks are in the Dow? As of April 2023, the stocks in the Dow Jones currently includes all of the following publicly traded companies:

Editors of The Wall Street Journal (owned by Dow Jones & Company) are responsible for selecting and rebalancing the index. The editors consider various factors when deciding which companies to include but generally focus on large, well-established companies with a history of stable earnings and a solid reputation in their industry.

List of stocks in the Dow Jones Industrial Average (DJIA)

History of the Dow Jones Industrial Average (DJIA)

The Dow Jones Industrial Average was first created in 1896 by Charles Dow, the co-founder of Dow Jones & Company. At the time, the index included just 12 companies, all in the industrial sector.

Over the years, the composition of the DJIA has changed several times. The number of stocks in the Dow included in the index has increased from 12 to 30, and the industries represented in the index have broadened beyond just industrial companies. The first changes to the index came in 1916, when the number of companies increased to 20, and then again in 1928, when the number of companies grew to 30 (where it has remained ever since).

Today's stocks in the Dow 30 are all recognizable names in major industries, including retailers like Walmart and tech companies like Microsoft. The Dow uses a price-weighting strategy and includes only a select group of industry leaders, setting it apart from other indexes. However, many of the major players in each category are the same between index calculations, so you'll find overlap with roundups like this list of FAANG stocks on MarketBeat.

While the DJIA is a major index, it is not the only way to measure the overall health of the American economy. The following major indexes complement the Dow—while they may share some of the same assets, different weighting and inclusion criteria make them unique. 

Nasdaq Composite Index

The Nasdaq Composite Index is a stock market index that tracks the performance of more than 3,000 publicly traded companies listed on the Nasdaq stock exchange. The Nasdaq exchange is primarily known for listing technology and growth-oriented companies, but it also includes companies from other sectors such as healthcare, consumer services and finance.

Unlike the DJIA, which includes just 30 large-cap U.S. companies, the Nasdaq Composite Index is a broader market index that includes companies of all sizes and from various industries. Additionally, the Nasdaq Composite Index is a market-capitalization-weighted index, meaning that companies with larger market capitalizations have a more significant impact on the index's performance. This is in contrast to the Dow, which is a price-weighted index. 

Overall, the Nasdaq Composite Index will give you a broader understanding of market price movements, while the Dow shows the performance of a select grouping of companies. If you don't have time to review the entire index, browse this selection of the best NASDAQ stocks to buy compiled by MarketBeat. 

S&P 500 Index

The S&P 500 Index is a market-capitalization-weighted index of the 500 largest U.S. companies operating on publicly traded markets. Companies included in this index are chosen based on total market capitalization, liquidity and industry sector representation. The S&P 500 index is designed to represent a broad cross-section of the U.S. economy and includes companies from a range of industries. You can view a complete list of S&P 500 stocks

Like the Nasdaq Composite Index, the S&P 500 Index is a broader market index than the DJIA, as it includes many companies and covers a wider range of industries. However, unlike the Nasdaq Composite Index, the S&P 500 Index only includes companies based in the United States. 

Also, unlike the DJIA, the S&P 500 features a market-weighted calculation, which means that companies with more assets under control make up a larger percentage of the index. The DJIA's price-weighting structure gears the index more heavily towards assets with higher share prices. Learning more about comparing stocks on MarketBeat or using another market news source can help you incorporate multiple indexes with different weighting structures into your portfolio.  

Russell 2000

The Russell 2000 is another stock market index designed to track the performance of small-cap U.S. companies. The index comprises the smallest 2,000 companies in the Russell 3000 Index, a broader market index covering 3,000 U.S. companies. 

The Russell 2000 Index varies from the Dow Jones Industrial Average in several ways. First, the Russell 2000 Index covers a different segment of the U.S. stock market, focusing on small-cap companies rather than large-cap companies. The DJIA includes only 30 large-cap U.S. companies, while the Russell 2000 Index covers a much larger number of smaller companies. This means that, like the Nasdaq Composite and the S&P 500, the data you receive from the Russell 2000 is more generalized across multiple market sectors, rather than individual companies. 

2 Ways to Invest in Dow Stocks

Now that you understand what stocks are in the Dow Jones and how the DJIA index is calculated, it's time to learn about practical ways to invest in the DJIA's assets. The following are 2 of the most common ways to invest in stocks that comprise the Dow. 

Individual Stocks 

The Dow comprises 30 individual stocks, which you can buy and sell as individual shares using a brokerage account. Research the companies that make up the Dow using the list above and select a few to add to your portfolio. Then, place a buy order through your brokerage account of choice. Monitor your stocks' performance over time, and consider tax considerations for any dividends you receive. 

ETFs

If you're looking for a faster and easier way to invest in all of the stocks that make up the DJIA, you may want to consider a Dow Jones ETF. An exchange-traded fund (ETF) is a managed grouping of stocks that trades daily as a singular asset. Dow Jones ETFs are composed of the stocks that make up the Dow, allowing you to invest in a weighted grouping without placing 30 individual buy orders. Some examples of DJIA ETFs include the SPDR Dow Jones Industrial Average ETF (NYSE: DIA) and the iShares Dow Jones U.S. ETF (NYSE: YYY).

image of iShares Dow Jones ETF on MarketBeat

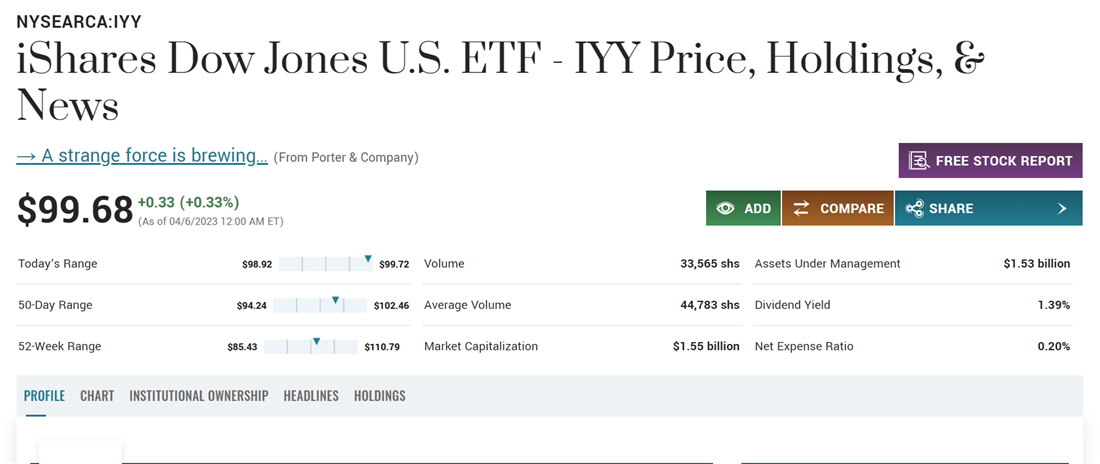
Image: The iShares Dow Jones U.S. ETF is one of the ETFs that track the performance of the DJIA index

Pros and Cons of Investing in Dow Stocks

Understanding both the pros and cons of investing in the assets that make up the Dow Jones Industrial Average is essential to any investor. Be sure to consider all of the following points before placing a buy order, and consider consulting with a financial professional before making any major financial decisions. 

Pros

First, the benefits:

  • Diversification: The Dow comprises 30 large, established companies from various industries, which can provide an instant level of diversification for your portfolio. A DJIA ETF can make the process of diversifying and protecting your initial investment even simpler. 
  • Long-term growth potential: Many of the companies in the Dow have a long history of success and stability and may continue to grow over the long term. Editors at the Wall Street Journal actively reassess and evaluate the assets in the Dow, offering professional oversight you won't get through individual investing on your own. 
  • Dividends: Many stocks in DJIA pay dividends, which can provide a source of regular income for investors.

Cons

Next, the downsides:

  • Concentration: The Dow only tracks 30 companies, so your investments may concentrate on a few key industries. This can lead to higher rates of losses if the specific sectors you're buying into see sharp losses.
  • Limited exposure: The Dow is only made up of U.S.-based companies so investors may miss out on opportunities for international exposure. This can also lead to concentrated losses if the American economy turns negative. 

Consider Investing in the Dow

There's a reason why the DJIA has remained a significant stock indicator since its inception more than 100 years ago. The companies that make up the Dow are mainstays of the American economy, proving their worth by weathering through both bull and bear markets. However, new investors, in particular, need to remember that the stocks that make up the Dow represent only a small section of the American economy — and diversify accordingly. 

FAQs

Take a look at some frequently asked questions about investing in the Dow and stocks in Dow.

What stocks make up the Dow?

The Dow comprises 30 American companies, each representing a major name in its sector. Some examples of well-known companies that make up the Dow include UnitedHealthcare, Coca-Cola and JP Morgan Chase. 

How many stocks are in the Dow?

There are currently 30 stocks in the Dow, which has been the case since 1928. While the Dow Jones has changed the number of companies included in the index in the past, it is now set at 30. 

What is the biggest company in the Dow?

As of April 2023, the largest company in the Dow Jones Industrial Average by market capitalization is Apple, which makes up about 13% of the index.

My Account -