What Are Analyst Stock Ratings?
Stock price targets and analyst ratings are like report card grades issued by brokerage and research firms. These ratings accompany a research report by one of its analysts following the company's business and stock performance. The research report provides insights into the reasoning for the analyst rating, earnings performance estimates, and a price target.
Analysts are assigned to cover many stocks. They will follow them throughout the year, staying on top of news and material events like earnings reports. When an analyst upgrades or downgrades a stock, they will adjust their rating with an update to their research. When there is more coverage on a stock, meaning more analysts issuing ratings, the company tends to get more attention, leading to more involvement from the institution and investors.
This, in turn, results in more trading volume and liquidity. When several firms issue analyst ratings on the same stock, consensus estimates can be derived as well as an average rating, which investors use in making their own decisions to buy or sell the stock.
What Are Canadian Analyst Stock Ratings?
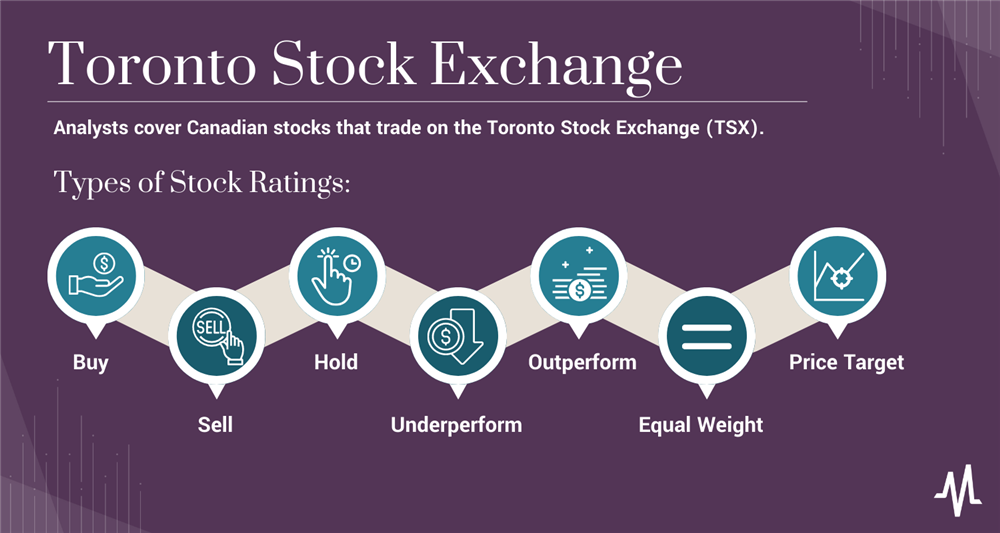
Analysts tend to cover Canadian stocks that trade on the Toronto Stock Exchange, also known as TSX. The more widely followed Canadian stocks tend to trade in the TSX index. The TSX composite index is the Canadian benchmark index and includes nearly 70% of the total market capitalization of the Toronto Stock Exchange.
The TSX has around 1,640 companies with a combined market cap of over $3 trillion. Many dual-listed stocks are on the TSX and the U.S. stock market, especially companies based in Canada.
How to Use Analyst Ratings
When you use an analyst rating to make investment decisions, it's important to remain objective and review more than one analyst report. Analysts can have different opinions on stock and thus have different ratings. It's good to compare and contrast them before deciding whether to invest in a particular stock. It helps to know how to screen stocks to find candidates. When you find a stock to research, look for analyst ratings and available research reports. Here are some steps to take in your stock research:
Step 1: Review the analyst rating and price target.
Observe the analyst rating to gauge the company's expected performance and the price target for the stock's performance. It's essential to gauge whether it's an initiation or a rating change which can be an upgrade or downgrade. Initiation means the initial coverage from the analyst on the stock with a price target. A rating change implies that something happened or is about to happen to warrant a change in the analyst's opinion on the performance of the stock.
For example, an analyst may upgrade a stock after its earnings report. This means the earnings report was good enough for the analyst to change their opinion on the stock based on the new information presented by the company. Upgraded stocks tend to induce buying and downgraded stocks tend to induce selling.
Step 2: Observe the ratings date and stock reaction.
Watch the date of the stock ratings initiation or change. The older the rating, the more it could be outdated. If the rating is over four months, it may not include the information provided by its latest earnings report, or something has stayed the same to warrant a rating change. It's also important to see how the stock reacted to the analyst rating. You can match the analyst rating date on a stock chart to see if the stock made a meaningful move. Popular analysts and higher credible firms generate more of an impact on their stock ratings as they build up a more extensive following from accurate past ratings.
Step 3: Review the research report.
If you have access to the research report, read through it and note the most relevant points, like essential catalysts. For example, an analyst may cite a new product upgrade cycle expected in the next quarter with a new pipeline of products and services behind a stock upgrade. This makes sense, and the price chart is flat or down with a 20% upside to the analyst price target — pertinent material information that may give you reasons to invest wisely in the stock.
Step 4: Note the catalysts and expectations.
In addition to the catalysts, note the analyst expectations for its upcoming earnings report. These include the expected earnings per share (EPS) and expected revenues. When a stock has multiple analysts covering it, you can search for the consensus analyst estimates, an average of the different performance expectations. Sometimes, there are whisper numbers which are even higher expectations that a company has to beat for the stock price to react positively.
Step 5: Review other analyst ratings on the stock.
After assessing the analyst rating, you can repeat the process with each new analyst rating for the stock. After reviewing a few stock ratings, you should be able to gauge your opinion of the company to make a more informed decision on the stock.
Analyst Rating Accuracy
In the world of analysts, some analysts perform better than others. Ratings accuracy is based on the reaction from the stock performance after the ratings initiation or change and the accuracy of reaching its target price. Top analysts tend to have more eyeballs and credibility with their ratings. In turn, it results in a more dramatic effect on stock prices. Top analysts interview on television, in newspapers and on financial news websites. Like esteemed food critics, they can often make or break a stock. The more accurate their ratings, the more credibility they tend to gain. It pays to know which Wall Street analysts are the most accurate.
Where Analysts Ratings Come From
Analyst ratings can come from investment banks, brokerage firms' research departments or independent research firms. Many investment banks that underwrite a company's initial public offering (IPO) will assign an analyst to cover the stock and provide stock ratings.
Types of Stock Ratings
Stock ratings are like an analyst's report card on the company's performance. It can be subjective, so there are different variations by different firms. However, there are six universal ratings that analysts and Canadian analysts issue when making a stock rating.
Buy
A "buy" rating indicates the analyst is bullish on the stock and advises purchasing the stock. Usually, the company has strong performance or upcoming catalysts warrant purchasing the shares. There may have been a strong earnings beat or a spike in insider buying. When an analyst is emphatic about the company, they may issue a strong "buy" rating, which adds urgency to the buy rating, implying that it's advantageous to buy the stock as soon as possible.
Sell
A "sell" rating is applied to stocks that an analyst views as overvalued or the underlying business is rapidly deteriorating. The company may have lowered its forward guidance, or there's a big spike of insider selling. Sell ratings are less popular. Some traders will see the sell rating as an opportunity to short-sell the stock in anticipation of lower prices as investors sell their shares, driving down the price.
Hold
A "hold" rating suggests the company is performing adequately with no reason to buy more or sell the shares. It's often associated with a neutral rating, implying no remarkable catalysts to spark immediate action with the stock.
This rating compares the stock performance to the overall market, usually against a benchmark index like the S&P 500 or the TSX. An underperforming rating implies that the stock will perform less than the benchmark index. For example, if the S&P 500 index is up 5%, the analyst expects a stock with an underperforming rating to rise less than 5%.
The "outperform" rating asserts the stock will do better than the benchmark index. If the S&P 500 is up 10% for the year, an outperform rating implies the stock should perform better than 10% for the year. Outperform ratings are based on how the analyst believes the stock will perform against a benchmark index, usually against its peers.
Equal Weight
"Equal weight" is like a hold rating in relation to the stock price. Equal weight ratings imply the stock should perform equally to the benchmark index. If the S&P 500 is up 2% for the year, stocks should be rated equal weight.
Price Target
A price target accompanies most analyst ratings or the price target the analyst expects the stock to achieve. If analysts upgrade stock to a buy rating from a hold rating, they will also tend to raise the stock price target. Price targets can go up or down with or without a ratings change.
Consider the Whole Package
A stock rating is simply the opinion of one analyst. These opinions may differ widely between analysts. It's best to get multiple analyst ratings to make more informed investment decisions. Ultimately, the market will make its own decision regarding the stock's performance, thereby proving the analyst right or wrong. However, the market is sometimes wrong too. It may be early or late and often tends to overreact in both directions, providing windows of opportunity for you.