QQQ   337.27 (+1.86%)
AAPL   175.05 (+1.37%)
MSFT   318.52 (+1.44%)
META   246.85 (+1.80%)
GOOGL   122.83 (+1.65%)
AMZN   118.15 (+2.29%)
TSLA   176.89 (+1.74%)
NVDA   316.78 (+4.97%)
NIO   7.82 (-2.62%)
BABA   85.77 (-5.41%)
AMD   107.93 (+4.03%)
T   16.55 (-0.66%)
F   11.64 (+1.22%)
MU   67.57 (+4.08%)
CGC   1.05 (+0.00%)
GE   104.01 (+0.52%)
DIS   93.76 (+1.07%)
AMC   5.07 (-0.59%)
PFE   36.48 (-0.73%)
PYPL   61.27 (-0.31%)
NFLX   371.29 (+9.22%)

Dividend Contenders

Dividend Contenders are U.S. public companies that have raised their dividends for 10 or more consecutive years, but less than 25 years. Like the Dividend Champions list (25+ years of consecutive dividend growth) and the Dividend Challengers list (5-9 years of consecutive dividend growth), it was created by David Fish and is maintained by the DRIP Investing Resource Center, a non-profit investing resource organization.

Learn more about trading stocks based on dividends.

MarketRank evaluates a company based on community opinion, dividend strength, institutional and insider ownership, earnings and valuation, and analysts forecasts.
Available with a MarketBeat All Access Subscription
MarketRank™Upgrade to All Access to use the All Ranks Filter
Media sentiment refers to the percentage of positive news stories versus negative news stories a company has received in the past week.
Available with a MarketBeat All Access Subscription
Media SentimentUpgrade to All Access to use the All Sentiments Filter
Analyst consensus is the average investment recommendation among Wall Street research analysts.
Available with a MarketBeat All Access Subscription
Analyst ConsensusUpgrade to All Access to use the All Ratings Filter
CompanyCurrent PriceDividend YieldAnnual PayoutPayout Ratio3-Year Dividend GrowthEx-Dividend DateIndicator(s)
Accenture plc stock logo
ACN
Accenture
$287.48
+1.0%
1.56%$4.4835.90% 10.96%N/AAnalyst Report
Agilent Technologies, Inc. stock logo
A
Agilent Technologies
$129.14
+1.1%
0.70%$0.9014.29% 8.36%N/AUpcoming Earnings
Analyst Report
Short Interest ↓
Alexandria Real Estate Equities, Inc. stock logo
ARE
Alexandria Real Estate Equities
$116.91
-1.8%
4.14%$4.84166.90% 5.67%N/A
ALLETE, Inc. stock logo
ALE
ALLETE
$61.48
-0.1%
4.41%$2.7166.42% 3.43%N/AAnalyst Report
Alliant Energy Co. stock logo
LNT
Alliant Energy
$52.64
-0.2%
3.44%$1.8157.28% 6.39%N/AAnalyst Report
Positive News
Altria Group, Inc. stock logo
MO
Altria Group
$45.07
-0.6%
8.34%$3.7671.35% 3.91%N/AAnalyst Report
Amdocs Limited stock logo
DOX
Amdocs
$95.27
+1.1%
1.83%$1.7426.69% 11.49%6/29/2023Analyst Upgrade
Ameren Co. stock logo
AEE
Ameren
$83.36
+0.0%
3.02%$2.5253.73% 7.12%6/13/2023Dividend Announcement
Analyst Report
Options Volume
Analyst Revision
American Electric Power Company, Inc. stock logo
AEP
American Electric Power
$86.64
-0.5%
3.83%$3.3259.07% 5.37%N/AAnalyst Report
American Equity Investment Life Holding stock logo
AEL
American Equity Investment Life
$39.13
+1.0%
0.05%$0.020.30% 6.27%N/AAnalyst Report
American Financial Group, Inc. stock logo
AFG
American Financial Group
$117.73
+1.9%
2.14%$2.5220.31% 11.87%N/AAnalyst Report
Positive News
American Tower Co. stock logo
AMT
American Tower
$191.03
-1.9%
3.27%$6.24127.35% 15.74%N/AAnalyst Report
Short Interest ↑
American Water Works Company, Inc. stock logo
AWK
American Water Works
$141.73
-1.3%
2.00%$2.8355.27% 9.42%N/AAnalyst Report
Ameriprise Financial, Inc. stock logo
AMP
Ameriprise Financial
$303.70
+0.9%
1.78%$5.4016.23% 8.60%N/AAnalyst Report
Short Interest ↓
AMERISAFE, Inc. stock logo
AMSF
AMERISAFE
$54.82
-0.3%
2.48%$1.3646.90% 7.43%6/15/2023Analyst Report
Short Interest ↑
Positive News
AmerisourceBergen Co. stock logo
ABC
AmerisourceBergen
$174.82
+0.0%
1.11%$1.9415.29% 5.24%N/AAnalyst Report
Insider Selling
Analyst Revision
Ames National Co. stock logo
ATLO
Ames National
$17.90
-0.6%
6.03%$1.08N/A 4.00%7/31/2023Analyst Report
Amgen Inc. stock logo
AMGN
Amgen
$224.23
-0.4%
3.80%$8.5244.31% 10.14%N/AAnalyst Report
Options Volume
Amphenol Co. stock logo
APH
Amphenol
$76.14
+0.9%
1.10%$0.8426.17% 19.06%6/16/2023Analyst Report
Insider Selling
Short Interest ↑
Analyst Revision
Analog Devices, Inc. stock logo
ADI
Analog Devices
$192.26
+2.3%
1.79%$3.4431.19% 12.07%N/AUpcoming Earnings
Analyst Upgrade
Aon plc stock logo
AON
AON
$324.23
+0.6%
0.76%$2.4615.27% 8.39%N/AAnalyst Report
Short Interest ↑
Apogee Enterprises, Inc. stock logo
APOG
Apogee Enterprises
$39.02
+0.6%
2.46%$0.9623.82% 7.93%N/AAnalyst Report
Apple Inc. stock logo
AAPL
Apple
$175.05
+1.4%
0.55%$0.9614.61% 6.19%N/AAnalyst Report
Short Interest ↑
Applied Industrial Technologies, Inc. stock logo
AIT
Applied Industrial Technologies
$130.15
+0.6%
1.08%$1.4016.22% 3.13%N/AAnalyst Report
Analyst Revision
Arrow Financial Co. stock logo
AROW
Arrow Financial
$19.67
+0.6%
5.49%$1.0835.53% 4.30%6/1/2023Upcoming Earnings
News Coverage
Arthur J. Gallagher & Co. stock logo
AJG
Arthur J. Gallagher & Co.
$214.50
-0.2%
1.03%$2.2022.18% 5.85%6/1/2023Analyst Report
Analyst Revision
Assurant, Inc. stock logo
AIZ
Assurant
$131.79
+1.3%
2.12%$2.8020.41% 4.08%5/26/2023Dividend Announcement
Assured Guaranty Ltd. stock logo
AGO
Assured Guaranty
$52.77
+0.8%
2.12%$1.1219.58% 11.57%N/AShort Interest ↓
Positive News
Atlantic Union Bankshares Co. stock logo
AUB
Atlantic Union Bankshares
$25.27
-0.5%
4.75%$1.20N/A 32.38%5/18/2023Positive News
Atrion Co. stock logo
ATRI
Atrion
$553.90
-1.4%
1.55%$8.60N/A 12.24%N/AAnalyst Report
Short Interest ↓
Auburn National Bancorporation, Inc. stock logo
AUBN
Auburn National Bancorporation
$21.78
4.96%$1.08N/A 1.96%6/8/2023
Avery Dennison Co. stock logo
AVY
Avery Dennison
$171.02
+0.5%
1.75%$3.0028.68% 9.04%6/6/2023Analyst Report
Analyst Revision
Avista Co. stock logo
AVA
Avista
$42.52
-0.6%
4.33%$1.8474.80% 4.33%5/25/2023Dividend Announcement
Analyst Report
Short Interest ↓
AXIS Capital Holdings Limited stock logo
AXS
AXIS Capital
$55.82
+2.8%
3.15%$1.7619.95% 2.43%6/29/2023Analyst Report
Analyst Revision
Balchem Co. stock logo
BCPC
Balchem
$123.66
+0.4%
0.57%$0.7116.71% 10.94%N/AAnalyst Report
Bank of Marin Bancorp stock logo
BMRC
Bank of Marin Bancorp
$17.07
+0.2%
5.86%$1.0049.50% 7.00%N/AAnalyst Report
Best Buy Co., Inc. stock logo
BBY
Best Buy
$73.04
-1.2%
5.04%$3.6852.42% 20.74%N/AUpcoming Earnings
Analyst Report
BlackRock, Inc. stock logo
BLK
BlackRock
$669.33
+2.9%
2.99%$20.0049.85% 13.93%N/AAnalyst Report
Blue Ridge Bankshares, Inc. stock logo
BRBS
Blue Ridge Bankshares
$8.60
+5.4%
5.70%$0.49N/A 24.38%N/A
BOK Financial Co. stock logo
BOKF
BOK Financial
$80.81
+0.2%
2.67%$2.1624.00% 1.95%N/AAnalyst Report
Positive News
Booz Allen Hamilton Holding Co. stock logo
BAH
Booz Allen Hamilton
$93.35
+0.3%
2.01%$1.8834.56% 21.46%N/AAnalyst Report
Bristol-Myers Squibb stock logo
BMY
Bristol-Myers Squibb
$65.70
-1.2%
3.47%$2.2827.94% 9.24%N/AAnalyst Report
Short Interest ↑
Analyst Revision
Broadcom Inc. stock logo
AVGO
Broadcom
$677.90
+3.1%
2.71%$18.4041.69% 14.70%N/AAnalyst Report
Broadridge Financial Solutions, Inc. stock logo
BR
Broadridge Financial Solutions
$154.19
+0.9%
1.88%$2.9038.51% 10.02%6/14/2023Analyst Report
Short Interest ↑
News Coverage
Positive News
Brookfield Asset Management Ltd. stock logo
BAM
Brookfield Asset Management
$31.19
-1.3%
4.10%$1.2880.00% -4.35%5/30/2023Analyst Report
Positive News
Brunswick Co. stock logo
BC
Brunswick
$80.01
+3.3%
2.00%$1.6014.25% 18.84%N/AAnalyst Report
Casey's General Stores, Inc. stock logo
CASY
Casey's General Stores
$229.04
-0.3%
0.66%$1.5213.79% 6.03%N/AAnalyst Report
Positive News
Cboe Global Markets, Inc. stock logo
CBOE
Cboe Global Markets
$137.25
+0.5%
1.46%$2.0026.60% 13.51%N/AAnalyst Report
Celanese Co. stock logo
CE
Celanese
$107.51
+1.7%
2.60%$2.8019.93% 4.52%N/AAnalyst Report
Insider Buying
Short Interest ↓
Analyst Revision
Chemed Co. stock logo
CHE
Chemed
$536.27
-0.8%
0.28%$1.526.68% 6.08%5/24/2023Dividend Announcement
Analyst Report
Chesapeake Utilities Co. stock logo
CPK
Chesapeake Utilities
$125.23
+1.5%
1.71%$2.1436.77% 9.57%6/14/2023Analyst Report
Short Interest ↓
High Trading Volume
ChoiceOne Financial Services, Inc. stock logo
COFS
ChoiceOne Financial Services
$21.07
-0.5%
4.94%$1.04N/A 8.08%N/ANews Coverage
Churchill Downs Incorporated stock logo
CHDN
Churchill Downs
$289.00
+1.4%
0.25%$0.714.81% 7.11%N/AAnalyst Report
Cisco Systems, Inc. stock logo
CSCO
Cisco Systems
$48.20
+1.2%
3.24%$1.5638.71% 2.78%N/AEarnings Report
Dividend Announcement
Analyst Report
News Coverage
Gap Down
High Trading Volume
City Holding stock logo
CHCO
City
$90.42
+0.1%
2.88%$2.6037.14% 4.35%N/AAnalyst Report
CME Group Inc. stock logo
CME
CME Group
$181.81
-0.4%
2.42%$4.4049.61% 10.06%6/8/2023Analyst Report
CNO Financial Group, Inc. stock logo
CNO
CNO Financial Group
$22.44
+1.7%
2.50%$0.5618.42% 8.55%6/8/2023Analyst Report
Analyst Revision
Cogent Communications Holdings, Inc. stock logo
CCOI
Cogent Communications
$62.52
+0.1%
5.98%$3.74271.01% 13.37%N/AAnalyst Report
Cohen & Steers, Inc. stock logo
CNS
Cohen & Steers
$56.67
+1.4%
4.02%$2.2866.28% 15.17%N/AAnalyst Downgrade
News Coverage
Comcast Co. stock logo
CMCSA
Comcast
$41.31
+2.5%
2.81%$1.1628.16% 8.74%N/AAnalyst Report
Analyst Revision
Comfort Systems USA, Inc. stock logo
FIX
Comfort Systems USA
$154.03
+1.9%
0.45%$0.708.99% 12.34%N/AAnalyst Report
Positive News
Community Bank System, Inc. stock logo
CBU
Community Bank System
$48.56
+0.3%
3.62%$1.7650.00% 3.27%N/APositive News
Corning Incorporated stock logo
GLW
Corning
$31.29
+1.5%
3.58%$1.1247.06% 10.52%5/30/2023Analyst Report
Costco Wholesale Co. stock logo
COST
Costco Wholesale
$498.10
+0.6%
0.82%$4.0826.24% 11.47%N/AUpcoming Earnings
Analyst Report
Short Interest ↓
CSG Systems International, Inc. stock logo
CSGS
CSG Systems International
$49.08
+0.2%
2.28%$1.1229.02% 6.00%N/AAnalyst Report
Insider Selling
Short Interest ↑
CSX Co. stock logo
CSX
CSX
$32.39
+1.4%
1.36%$0.4421.26% 7.72%5/30/2023Analyst Downgrade
Short Interest ↓
CubeSmart stock logo
CUBE
CubeSmart
$44.78
-1.4%
4.38%$1.96114.62% 11.33%6/30/2023Dividend Announcement
Analyst Report
Cummins Inc. stock logo
CMI
Cummins
$214.65
+0.2%
2.93%$6.2832.24% 7.21%5/18/2023Analyst Report
Delek Logistics Partners, LP stock logo
DKL
Delek Logistics Partners
$46.95
+7.8%
8.73%$4.1083.84% 5.36%N/AAnalyst Report
Short Interest ↓
DENTSPLY SIRONA Inc. stock logo
XRAY
DENTSPLY SIRONA
$40.50
+0.9%
1.38%$0.5624.45% 10.06%N/AAnalyst Report
Digital Realty Trust, Inc. stock logo
DLR
Digital Realty Trust
$94.20
-1.5%
5.18%$4.88375.38% 4.15%N/AAnalyst Report
Insider Selling
Analyst Revision
Positive News
Discover Financial Services stock logo
DFS
Discover Financial Services
$100.61
+2.0%
2.78%$2.8019.62% 11.04%5/24/2023Analyst Report
Short Interest ↓
Domino's Pizza, Inc. stock logo
DPZ
Domino's Pizza
$311.36
+2.1%
1.55%$4.8432.27% 19.17%6/14/2023Analyst Report
Analyst Revision
Donegal Group Inc. stock logo
DGICA
Donegal Group
$14.82
+0.9%
4.59%$0.6850.37% 4.40%N/AAnalyst Downgrade
Douglas Dynamics, Inc. stock logo
PLOW
Douglas Dynamics
$29.11
+1.3%
4.05%$1.1846.83% 2.10%N/AAnalyst Report
DTE Energy stock logo
DTE
DTE Energy
$108.90
-0.2%
3.50%$3.8157.12% -2.12%6/15/2023Analyst Report
Analyst Revision
Duke Energy Co. stock logo
DUK
Duke Energy
$92.81
-0.2%
4.33%$4.0267.00% 2.05%N/AAnalyst Report
Short Interest ↓
Eagle Bancorp Montana, Inc. stock logo
EBMT
Eagle Bancorp Montana
$12.80
+3.3%
4.30%$0.5529.10% 11.87%N/AAnalyst Report
EastGroup Properties, Inc. stock logo
EGP
EastGroup Properties
$162.80
-0.2%
3.07%$5.00127.23% 16.93%N/AAnalyst Report
Short Interest ↑
Eastman Chemical stock logo
EMN
Eastman Chemical
$83.38
+2.9%
3.79%$3.1635.03% 6.80%6/14/2023Analyst Revision
Eaton Co. plc stock logo
ETN
Eaton
$174.61
+2.1%
1.97%$3.4437.27% 4.49%N/A
Edison International stock logo
EIX
Edison International
$68.85
-1.3%
4.28%$2.9557.84% 4.66%N/AAnalyst Report
Short Interest ↓
Analyst Revision
Elevance Health, Inc. stock logo
ELV
Elevance Health
$455.01
-1.0%
1.30%$5.9215.99% 16.96%6/8/2023Analyst Report
Enterprise Bancorp, Inc. stock logo
EBTC
Enterprise Bancorp
$28.26
+1.0%
3.26%$0.92N/A 8.61%N/AAnalyst Report
Equity LifeStyle Properties, Inc. stock logo
ELS
Equity LifeStyle Properties
$64.74
-2.1%
2.76%$1.79102.29% 10.21%6/29/2023Analyst Report
Short Interest ↓
News Coverage
Trading Halted
Evans Bancorp, Inc. stock logo
EVBN
Evans Bancorp
$23.99
-1.2%
5.50%$1.3244.75% 6.61%N/AAnalyst Report
Evans Bancorp, Inc. stock logo
EVBN
Evans Bancorp
$23.99
-1.2%
5.50%$1.3244.75% 6.61%N/AAnalyst Report
Evercore Inc. stock logo
EVR
Evercore
$108.84
+0.8%
2.65%$2.8823.08% 8.23%5/25/2023Analyst Report
Short Interest ↓
Evergy, Inc. stock logo
EVRG
Evergy
$59.24
-0.3%
4.14%$2.45N/A 6.48%5/18/2023Insider Selling
Short Interest ↓
Extra Space Storage Inc. stock logo
EXR
Extra Space Storage
$149.18
0.0%
4.34%$6.48102.37% 19.01%N/AAnalyst Report
Positive News
Fastenal stock logo
FAST
Fastenal
$55.24
+1.9%
2.53%$1.4065.42% 12.54%N/AAnalyst Report
Short Interest ↑
Federal Agricultural Mortgage Co. stock logo
AGM
Federal Agricultural Mortgage
$140.41
+2.8%
3.13%$4.4030.58% 10.72%6/15/2023Analyst Report
Positive News
Fidelity National Financial, Inc. stock logo
FNF
Fidelity National Financial
$35.15
+1.8%
5.12%$1.8036.89% 12.00%6/15/2023Analyst Report
Fifth Third Bancorp stock logo
FITB
Fifth Third Bancorp
$25.17
-0.4%
5.24%$1.3237.82% 10.26%N/AAnalyst Report
Financial Institutions, Inc. stock logo
FISI
Financial Institutions
$16.98
+1.1%
7.07%$1.2038.59% 5.07%N/AAnalyst Report
Short Interest ↓
First American Financial Co. stock logo
FAF
First American Financial
$56.46
+0.7%
3.68%$2.0837.82% 7.03%6/7/2023Analyst Report
Short Interest ↑
Analyst Revision
First Business Financial Services, Inc. stock logo
FBIZ
First Business Financial Services
$27.13
+2.1%
3.35%$0.9121.98% 9.60%N/AAnalyst Report
Short Interest ↑
First Financial Bankshares, Inc. stock logo
FFIN
First Financial Bankshares
$26.93
-1.2%
2.67%$0.7248.00% 12.38%6/14/2023Analyst Report
Short Interest ↑
First Industrial Realty Trust, Inc. stock logo
FR
First Industrial Realty Trust
$52.28
+0.1%
2.45%$1.2882.05% 8.65%6/29/2023Analyst Report
Short Interest ↓
Positive News
First Interstate BancSystem, Inc. stock logo
FIBK
First Interstate BancSystem
$23.55
+0.8%
7.98%$1.8864.38% 11.09%N/AAnalyst Report
Insider Selling
Short Interest ↓
First Merchants Co. stock logo
FRME
First Merchants
$26.74
-0.1%
4.79%$1.2832.32% 7.72%6/1/2023Analyst Report
Short Interest ↑
Positive News
First Savings Financial Group, Inc. stock logo
FSFG
First Savings Financial Group
$12.46
+3.0%
4.49%$0.5619.05% 34.58%N/AAnalyst Report
Gap Down
Flowers Foods, Inc. stock logo
FLO
Flowers Foods
$28.84
+0.8%
3.05%$0.8865.19% 5.07%N/AEarnings Report
Analyst Report
News Coverage
Franco-Nevada Co. stock logo
FNV
Franco-Nevada
$152.20
-0.9%
0.89%$1.3633.58% 8.94%6/14/2023Analyst Report
Short Interest ↓
FS Bancorp, Inc. stock logo
FSBW
FS Bancorp
$28.80
-1.6%
3.47%$1.0020.45% 35.02%N/A
GATX Co. stock logo
GATX
GATX
$113.59
+0.2%
1.94%$2.2031.93% 4.17%6/14/2023Analyst Report
German American Bancorp, Inc. stock logo
GABC
German American Bancorp
$27.61
-0.9%
3.62%$1.0037.74% 10.60%N/AAnalyst Report
Positive News
Getty Realty Corp. stock logo
GTY
Getty Realty
$34.15
-0.5%
5.04%$1.72139.84% 5.34%6/21/2023Analyst Report
Short Interest ↓
Positive News
Glacier Bancorp, Inc. stock logo
GBCI
Glacier Bancorp
$29.53
+0.4%
4.47%$1.32N/A 2,574.26%N/A
Globe Life Inc. stock logo
GL
Globe Life
$108.89
+0.9%
0.83%$0.908.01% 33.99%N/AAnalyst Report
Short Interest ↓
Greene County Bancorp, Inc. stock logo
GCBC
Greene County Bancorp
$21.11
+1.9%
1.33%$0.28N/A 8.74%N/AAnalyst Upgrade
News Coverage
Griffon Co. stock logo
GFF
Griffon
$32.85
+2.6%
1.22%$0.4010.61% 8.15%5/24/2023
Hasbro, Inc. stock logo
HAS
Hasbro
$62.00
+0.0%
4.52%$2.8056.91% 0.97%N/AAnalyst Downgrade
Analyst Revision
Hawkins, Inc. stock logo
HWKN
Hawkins
$47.61
+10.6%
1.26%$0.60N/A 6.78%N/AAnalyst Report
Gap Up
High Trading Volume
Hawthorn Bancshares, Inc. stock logo
HWBK
Hawthorn Bancshares
$18.74
-0.7%
3.63%$0.68N/A 17.28%6/14/2023Analyst Report
News Coverage
Healthcare Services Group, Inc. stock logo
HCSG
Healthcare Services Group
$14.82
+0.7%
N/AN/A0.00% 2.46%N/AAnalyst Report
Positive News
HEICO Co. stock logo
HEI
HEICO
$178.68
+0.6%
0.11%$0.205.76% 8.20%N/AUpcoming Earnings
Analyst Report
Hillenbrand, Inc. stock logo
HI
Hillenbrand
$48.52
+1.0%
1.81%$0.8822.56% 1.17%6/15/2023Short Interest ↑
Hingham Institution for Savings stock logo
HIFS
Hingham Institution for Savings
$198.74
+0.4%
1.27%$2.52N/A 14.95%N/ANegative News
HNI Co. stock logo
HNI
HNI
$27.24
+1.8%
4.70%$1.2861.24% 1.63%6/8/2023Dividend Announcement
Analyst Report
Home Bancshares, Inc. (Conway, AR) stock logo
HOMB
Home Bancshares, Inc. (Conway, AR)
$21.82
+1.1%
3.30%$0.7235.64% 8.97%N/AAnalyst Report
Home Bancshares, Inc. (Conway, AR) stock logo
HOMB
Home Bancshares, Inc. (Conway, AR)
$21.82
+1.1%
3.30%$0.7235.64% 8.97%N/AAnalyst Report
Honeywell International Inc. stock logo
HON
Honeywell International
$198.25
+1.1%
2.08%$4.1240.87% 5.72%N/AAnalyst Report
Analyst Revision
Horace Mann Educators Co. stock logo
HMN
Horace Mann Educators
$33.10
3.99%$1.3237.18% 3.63%N/AAnalyst Report
Horizon Bancorp, Inc. stock logo
HBNC
Horizon Bancorp
$8.78
+0.6%
7.29%$0.6441.56% 11.05%N/AAnalyst Report
HP Inc. stock logo
HPQ
HP
$30.74
+1.6%
3.42%$1.0529.17% 15.52%6/13/2023Dividend Announcement
Analyst Report
Short Interest ↓
Hubbell Incorporated stock logo
HUBB
Hubbell
$280.57
+2.0%
1.60%$4.4831.98% 7.57%5/30/2023Analyst Upgrade
Humana Inc. stock logo
HUM
Humana
$513.87
-1.2%
0.69%$3.5411.03% 12.71%6/29/2023Analyst Report
Analyst Revision
Huntington Ingalls Industries, Inc. stock logo
HII
Huntington Ingalls Industries
$201.13
+0.2%
2.47%$4.9630.01% 9.81%5/25/2023Analyst Report
Hurco Companies, Inc. stock logo
HURC
Hurco Companies
$21.72
-1.0%
2.95%$0.64N/A 7.72%N/AAnalyst Report
Short Interest ↑
IDACORP, Inc. stock logo
IDA
IDACORP
$105.99
-1.2%
2.98%$3.1658.63% 5.90%N/AAnalyst Report
Short Interest ↓
Independent Bank Corp. stock logo
INDB
Independent Bank
$48.78
-1.2%
4.51%$2.2042.64% 5.73%N/AAnalyst Report
Short Interest ↑
Ingredion Incorporated stock logo
INGR
Ingredion
$111.27
+1.2%
2.55%$2.8429.34% 2.71%N/AAnalyst Report
Insperity, Inc. stock logo
NSP
Insperity
$110.85
+0.8%
1.88%$2.0832.60% 18.76%N/AAnalyst Report
International Flavors & Fragrances Inc. stock logo
IFF
International Flavors & Fragrances
$84.17
+2.3%
3.85%$3.2458.80% 2.63%6/22/2023Analyst Report
Intuit Inc. stock logo
INTU
Intuit
$447.66
+3.7%
0.70%$3.1220.14% 13.44%N/AUpcoming Earnings
Analyst Report
ITT Inc. stock logo
ITT
ITT
$82.41
+1.4%
1.41%$1.1621.09% 21.55%6/8/2023Analyst Report
J&J Snack Foods Corp. stock logo
JJSF
J&J Snack Foods
$156.80
-0.9%
1.79%$2.8052.83% 8.71%N/AAnalyst Report
Positive News
J.B. Hunt Transport Services, Inc. stock logo
JBHT
J.B. Hunt Transport Services
$170.69
-0.8%
0.98%$1.6817.45% 15.44%N/AAnalyst Report
Insider Selling
Short Interest ↓
Kadant Inc. stock logo
KAI
Kadant
$197.91
+0.8%
0.59%$1.1611.90% 4.17%N/AAnalyst Report
Kaiser Aluminum Co. stock logo
KALU
Kaiser Aluminum
$63.63
+2.5%
4.84%$3.0844.96% 8.67%N/AAnalyst Report
Kellogg stock logo
K
Kellogg
$69.05
-0.2%
3.42%$2.3654.63% 1.17%5/31/2023Analyst Report
KeyCorp stock logo
KEY
KeyCorp
$10.05
-1.3%
8.16%$0.8246.07% 3.62%5/26/2023Dividend Announcement
Analyst Report
Options Volume
Analyst Revision
KLA Co. stock logo
KLAC
KLA
$428.57
+2.8%
1.21%$5.2026.04% 14.88%N/AAnalyst Report
Insider Selling
Short Interest ↓
Analyst Revision
L3Harris Technologies, Inc. stock logo
LHX
L3Harris Technologies
$185.84
+0.0%
2.45%$4.5634.42% 44.01%6/1/2023Analyst Report
Short Interest ↑
Lakeland Bancorp, Inc. stock logo
LBAI
Lakeland Bancorp
$13.36
+0.6%
4.34%$0.5835.15% 5.17%N/A
Lazard Ltd stock logo
LAZ
Lazard
$28.72
+0.6%
6.96%$2.0053.33% 1.60%N/AAnalyst Report
Short Interest ↑
LeMaitre Vascular, Inc. stock logo
LMAT
LeMaitre Vascular
$63.15
-1.0%
0.89%$0.5638.89% 13.72%N/AAnalyst Report
Insider Selling
Lennox International Inc. stock logo
LII
Lennox International
$292.48
+2.0%
1.45%$4.2425.45% 11.60%6/29/2023Dividend Increase
Analyst Report
Short Interest ↑
Lindsay Co. stock logo
LNN
Lindsay
$119.89
+0.4%
1.13%$1.3620.61% 2.62%N/AAnalyst Report
Lithia Motors, Inc. stock logo
LAD
Lithia Motors
$227.67
+3.2%
0.88%$2.005.55% 10.60%N/AAnalyst Report
Littelfuse, Inc. stock logo
LFUS
Littelfuse
$268.77
+0.9%
0.89%$2.4016.25% 7.48%5/24/2023Analyst Report
Lockheed Martin Co. stock logo
LMT
Lockheed Martin
$455.75
-0.3%
2.63%$12.0043.12% 8.20%5/31/2023Analyst Report
LyondellBasell Industries stock logo
LYB
LyondellBasell Industries
$90.04
+1.0%
5.29%$4.7645.51% 4.24%N/AAnalyst Report
Short Interest ↓
Magellan Midstream Partners, L.P. stock logo
MMP
Magellan Midstream Partners
$62.67
+1.0%
6.69%$4.1979.81% 1.02%N/AAnalyst Report
Options Volume
High Trading Volume
Magna International Inc. stock logo
MGA
Magna International
$52.50
+1.3%
3.50%$1.8429.21% 7.23%5/18/2023Analyst Report
High Trading Volume
Main Street Capital Co. stock logo
MAIN
Main Street Capital
$39.25
+0.1%
6.88%$2.7071.05% 2.40%6/7/2023Analyst Report
ManpowerGroup Inc. stock logo
MAN
ManpowerGroup
$73.82
+1.5%
3.98%$2.9440.00% 7.66%5/31/2023Analyst Report
Short Interest ↓
MarketAxess Holdings Inc. stock logo
MKTX
MarketAxess
$288.03
-0.6%
1.00%$2.8833.18% 11.13%N/AAnalyst Report
Marsh & McLennan Companies, Inc. stock logo
MMC
Marsh & McLennan Companies
$179.37
+0.7%
1.32%$2.3627.93% 8.95%N/AAnalyst Report
Masco Co. stock logo
MAS
Masco
$53.60
+1.4%
2.13%$1.1430.32% 29.98%5/25/2023Dividend Announcement
Analyst Revision
Mastercard Incorporated stock logo
MA
Mastercard
$392.02
+1.3%
0.58%$2.2815.61% 3.70%N/AAnalyst Report
Insider Selling
Analyst Revision
Materion Co. stock logo
MTRN
Materion
$105.54
+1.0%
0.47%$0.507.67% 4.40%N/AAnalyst Upgrade
Matson, Inc. stock logo
MATX
Matson
$70.24
+0.9%
1.77%$1.2426.16% 12.36%N/AAnalyst Report
Insider Selling
Short Interest ↓
McKesson Co. stock logo
MCK
McKesson
$397.86
-0.8%
0.54%$2.167.14% 8.08%5/31/2023Analyst Report
Merck & Co., Inc. stock logo
MRK
Merck & Co., Inc.
$114.00
-0.7%
2.56%$2.9234.31% 7.40%N/AAnalyst Report
Analyst Revision
Microchip Technology Incorporated stock logo
MCHP
Microchip Technology
$78.30
+2.2%
1.83%$1.4322.00% 16.55%5/19/2023Analyst Report
Short Interest ↓
Microsoft Co. stock logo
MSFT
Microsoft
$318.52
+1.4%
0.85%$2.7224.73% 10.25%N/AAnalyst Report
Insider Selling
Mid-America Apartment Communities, Inc. stock logo
MAA
Mid-America Apartment Communities
$148.38
-0.4%
3.77%$5.60111.55% 8.73%7/13/2023Dividend Announcement
Analyst Downgrade
Analyst Revision
News Coverage
MidWestOne Financial Group, Inc. stock logo
MOFG
MidWestOne Financial Group
$19.11
+0.3%
5.08%$0.9732.77% 5.46%5/31/2023Analyst Report
Mondelez International, Inc. stock logo
MDLZ
Mondelez International
$77.27
+0.1%
1.99%$1.5444.38% 10.48%N/ADividend Announcement
Analyst Report
Analyst Revision
Monro, Inc. stock logo
MNRO
Monro
$45.05
-7.9%
2.49%$1.1261.88% 8.55%N/AAnalyst Upgrade
News Coverage
Gap Down
High Trading Volume
Moody's Co. stock logo
MCO
Moody's
$314.15
+1.8%
0.98%$3.0827.43% 11.87%5/18/2023Analyst Report
Morningstar, Inc. stock logo
MORN
Morningstar
$194.58
+0.9%
0.77%$1.5025.21% 37.37%N/AAnalyst Report
Insider Selling
Motorola Solutions, Inc. stock logo
MSI
Motorola Solutions
$296.53
+1.3%
1.19%$3.5228.41% 11.41%6/14/2023Dividend Announcement
Analyst Report
Insider Selling
MSC Industrial Direct Co., Inc. stock logo
MSM
MSC Industrial Direct
$92.79
+1.1%
3.41%$3.1650.00% 2.26%N/AAnalyst Report
Positive News
Nasdaq, Inc. stock logo
NDAQ
Nasdaq
$55.22
+0.5%
1.45%$0.8027.59% 8.15%6/15/2023Dividend Increase
Analyst Upgrade
National HealthCare Co. stock logo
NHC
National HealthCare
$59.48
+1.4%
3.83%$2.28N/A 3.14%N/AAnalyst Report
National HealthCare Co. stock logo
NHC
National HealthCare
$59.48
+1.4%
3.83%$2.28N/A 3.14%6/29/2023Insider Buying
Nexstar Media Group, Inc. stock logo
NXST
Nexstar Media Group
$163.12
-0.1%
3.31%$5.4017.99% 25.99%N/AAnalyst Report
Analyst Revision
NIKE, Inc. stock logo
NKE
NIKE
$118.87
+1.6%
1.14%$1.3628.33% 11.51%6/2/2023Analyst Report
Insider Selling
Northrim BanCorp, Inc. stock logo
NRIM
Northrim BanCorp
$38.15
+2.2%
6.29%$2.4046.42% 13.04%N/AAnalyst Report
Northrop Grumman Co. stock logo
NOC
Northrop Grumman
$443.60
-0.8%
1.56%$6.9227.95% 9.42%5/26/2023Dividend Increase
Analyst Report
Analyst Revision
NorthWestern Co. stock logo
NWE
NorthWestern
$58.37
+0.0%
4.39%$2.5670.72% 3.09%6/14/2023Analyst Report
Nu Skin Enterprises, Inc. stock logo
NUS
Nu Skin Enterprises
$36.43
-0.8%
4.28%$1.5656.12% 1.33%5/25/2023Analyst Report
OGE Energy Corp. stock logo
OGE
OGE Energy
$36.59
+0.4%
4.54%$1.6678.30% 3.08%N/AAnalyst Report
Positive News
Oil-Dri Co. of America stock logo
ODC
Oil-Dri Co. of America
$40.34
-2.3%
2.78%$1.12N/A 3.89%N/AAnalyst Report
Negative News
Otter Tail Co. stock logo
OTTR
Otter Tail
$75.75
-0.3%
2.31%$1.7549.86% 5.63%N/AAnalyst Report
Analyst Revision
PACCAR Inc stock logo
PCAR
PACCAR
$71.61
+0.1%
1.40%$1.0015.77% 3.64%N/AAnalyst Report
Packaging Co. of America stock logo
PKG
Packaging Co. of America
$129.23
+0.2%
3.87%$5.0059.74% 14.55%6/14/2023Analyst Report
Paychex, Inc. stock logo
PAYX
Paychex
$108.76
+1.4%
3.27%$3.5671.92% 7.78%N/AAnalyst Report
Peoples Bancorp of North Carolina, Inc. stock logo
PEBK
Peoples Bancorp of North Carolina
$20.06
-2.1%
3.79%$0.76N/A 8.74%N/AAnalyst Report
Perrigo Company plc stock logo
PRGO
Perrigo
$33.43
+1.7%
3.26%$1.0935.28% 8.24%6/1/2023Analyst Report
Insider Selling
Pfizer Inc. stock logo
PFE
Pfizer
$36.48
-0.7%
4.50%$1.6446.99% 3.31%N/AAnalyst Report
Analyst Revision
Philip Morris International Inc. stock logo
PM
Philip Morris International
$92.60
-1.0%
5.49%$5.0874.38% 2.94%N/AAnalyst Report
Pinnacle West Capital Co. stock logo
PNW
Pinnacle West Capital
$78.21
-0.4%
4.42%$3.4672.69% 4.11%N/A
PNM Resources, Inc. stock logo
PNM
PNM Resources
$45.89
0.0%
3.20%$1.4752.69% -15.32%N/AAnalyst Upgrade
Pool Co. stock logo
POOL
Pool
$353.22
+2.9%
1.25%$4.4026.13% 21.86%N/AAnalyst Upgrade
Portland General Electric stock logo
POR
Portland General Electric
$49.79
-0.8%
3.82%$1.9062.09% 5.61%6/23/2023Analyst Report
Analyst Revision
Premier Financial Corp. stock logo
PFC
Premier Financial
$14.72
+0.3%
8.42%$1.2453.22%N/AN/APositive News
Primerica, Inc. stock logo
PRI
Primerica
$186.72
+1.6%
1.39%$2.6015.06% 17.39%5/19/2023
Prologis, Inc. stock logo
PLD
Prologis
$122.06
-0.5%
2.85%$3.48112.62% 14.23%6/15/2023Analyst Report
Prudential Financial, Inc. stock logo
PRU
Prudential Financial
$82.39
+1.6%
6.07%$5.0038.23% 6.27%5/22/2023Analyst Report
Public Service Enterprise Group Incorporated stock logo
PEG
Public Service Enterprise Group
$61.41
-0.2%
3.71%$2.2861.79% 4.74%6/8/2023Analyst Report
Analyst Revision
Quaker Chemical Co. stock logo
KWR
Quaker Chemical
$208.13
+2.2%
0.84%$1.7420.12% 3.69%7/14/2023Analyst Report
Insider Selling
QUALCOMM Incorporated stock logo
QCOM
QUALCOMM
$106.96
+2.1%
2.80%$3.0031.25% 5.72%5/31/2023Analyst Report
Quest Diagnostics Incorporated stock logo
DGX
Quest Diagnostics
$130.92
-0.9%
2.17%$2.8431.07% 7.59%7/10/2023Dividend Announcement
Analyst Report
Reinsurance Group of America, Incorporated stock logo
RGA
Reinsurance Group of America
$150.07
+1.0%
2.13%$3.2017.90% 5.58%N/AEx-Dividend
Analyst Report
Insider Selling
Reliance Steel & Aluminum Co. stock logo
RS
Reliance Steel & Aluminum
$246.84
+1.3%
1.62%$4.0020.60% 16.74%5/25/2023Analyst Report
Analyst Revision
Republic Bancorp, Inc. stock logo
RBCAA
Republic Bancorp
$40.68
-0.2%
3.69%$1.5035.46% 8.91%N/AAnalyst Downgrade
Republic Services, Inc. stock logo
RSG
Republic Services
$144.71
-0.6%
1.37%$1.9833.79% 6.98%6/30/2023Analyst Report
RGC Resources, Inc. stock logo
RGCO
RGC Resources
$18.30
+0.6%
3.39%$0.6252.99% 5.31%7/14/2023Analyst Report
Positive News
High Trading Volume
Robert Half International Inc. stock logo
RHI
Robert Half International
$68.58
+1.9%
2.80%$1.9236.99% 11.52%5/24/2023Analyst Report
Positive News
Rockwell Automation, Inc. stock logo
ROK
Rockwell Automation
$281.11
+2.4%
1.68%$4.7236.50% 4.93%N/AAnalyst Report
Insider Selling
Analyst Revision
Royal Gold, Inc. stock logo
RGLD
Royal Gold
$129.44
-2.3%
1.16%$1.5035.71% 9.85%N/AAnalyst Report
Ryder System, Inc. stock logo
R
Ryder System
$81.13
+0.2%
3.06%$2.4821.49% 2.94%5/19/2023Analyst Report
Analyst Revision
Sandy Spring Bancorp, Inc. stock logo
SASR
Sandy Spring Bancorp
$22.00
-0.4%
6.18%$1.3645.64% 4.85%N/A
SB Financial Group, Inc. stock logo
SBFG
SB Financial Group
$13.35
+4.0%
3.90%$0.5233.33%N/AN/AAnalyst Report
Sempra Energy stock logo
SRE
Sempra Energy
$147.11
+0.2%
3.24%$4.7649.74% 5.78%7/3/2023Dividend Announcement
Analyst Report
Positive News
Service Co. International stock logo
SCI
Service Co. International
$65.47
+0.1%
1.65%$1.0827.98% 12.31%6/14/2023Analyst Report
Sierra Bancorp stock logo
BSRR
Sierra Bancorp
$15.98
+0.8%
5.76%$0.9237.70% 7.53%N/AAnalyst Report
Silgan Holdings Inc. stock logo
SLGN
Silgan
$47.33
-0.9%
1.52%$0.7216.82% 13.30%N/AUpcoming Earnings
Analyst Report
Silgan Holdings Inc. stock logo
SLGN
Silgan
$47.33
-0.9%
1.52%$0.7216.82% 13.30%5/31/2023
Silgan Holdings Inc. stock logo
SLGN
Silgan
$47.33
-0.9%
1.52%$0.7216.82% 13.30%5/31/2023
Simmons First National Co. stock logo
SFNC
Simmons First National
$16.49
4.85%$0.8042.78% 5.90%6/14/2023Analyst Report
Snap-on Incorporated stock logo
SNA
Snap-on
$261.26
+2.1%
2.48%$6.4835.12% 14.37%5/18/2023Analyst Report
Southern Missouri Bancorp, Inc. stock logo
SMBC
Southern Missouri Bancorp
$34.53
+1.3%
2.43%$0.8419.09% 13.56%N/AAnalyst Report
SouthState Co. stock logo
SSB
SouthState
$64.95
+0.7%
3.08%$2.0027.89% 5.84%N/AAnalyst Report
Southwest Gas Holdings, Inc. stock logo
SWX
Southwest Gas
$57.09
+0.8%
4.34%$2.4882.12% 4.39%8/14/2023Analyst Report
SpartanNash stock logo
SPTN
SpartanNash
$23.90
+1.1%
3.60%$0.8634.68% 3.39%N/AAnalyst Report
Spire Inc. stock logo
SR
Spire
$67.79
-0.4%
4.25%$2.8866.51% 4.96%6/9/2023Analyst Report
Standex International Co. stock logo
SXI
Standex International
$141.55
+1.6%
0.79%$1.1215.09% 8.93%N/AAnalyst Report
Star Group, L.P. stock logo
SGU
Star Group
$13.54
+2.5%
4.80%$0.65N/A 6.80%N/AAnalyst Report
Starbucks Co. stock logo
SBUX
Starbucks
$107.09
+1.3%
1.98%$2.1251.71% 9.83%N/AAnalyst Report
State Street Co. stock logo
STT
State Street
$69.06
+0.9%
3.65%$2.5229.13% 6.62%N/ADividend Announcement
Analyst Report
Steel Dynamics, Inc. stock logo
STLD
Steel Dynamics
$97.81
+1.2%
1.74%$1.7019.45% 12.31%6/29/2023Dividend Announcement
Analyst Report
Analyst Revision
Positive News
STERIS plc stock logo
STE
STERIS
$206.77
+0.5%
0.91%$1.8819.64% 8.23%6/13/2023Analyst Report
Insider Selling
Analyst Revision
Stock Yards Bancorp, Inc. stock logo
SYBT
Stock Yards Bancorp
$43.53
-1.5%
2.66%$1.1632.95% 3.11%6/16/2023Dividend Announcement
Analyst Report
News Coverage
TE Connectivity Ltd. stock logo
TEL
TE Connectivity
$123.09
+1.4%
1.82%$2.2429.71% 7.17%5/18/2023Analyst Upgrade
Analyst Revision
Terreno Realty Co. stock logo
TRNO
Terreno Realty
$61.37
-0.9%
2.61%$1.60115.94% 13.21%6/29/2023Analyst Report
Analyst Revision
Texas Instruments Incorporated stock logo
TXN
Texas Instruments
$169.81
+2.7%
2.92%$4.9661.54% 13.47%N/AAnalyst Report
The Aaron's Company, Inc. stock logo
AAN
Aaron's
$12.99
+2.2%
3.85%$0.5034.72% 45.86%6/14/2023Analyst Report
Short Interest ↓
The AES Co. stock logo
AES
AES
$20.86
-0.4%
3.16%$0.6634.38% 5.00%N/AShort Interest ↓
Analyst Revision
The Allstate Co. stock logo
ALL
Allstate
$118.89
-0.1%
2.99%$3.5627.18% 19.35%N/AAnalyst Report
Short Interest ↓
The Bank of New York Mellon Co. stock logo
BK
Bank of New York Mellon
$41.08
+1.0%
3.60%$1.4828.63% 6.37%N/AAnalyst Report
The Ensign Group, Inc. stock logo
ENSG
The Ensign Group
$90.85
-0.5%
0.25%$0.234.47% 4.95%N/AAnalyst Report
Insider Selling
Analyst Revision
The Gorman-Rupp Company stock logo
GRC
Gorman-Rupp
$25.60
+1.7%
2.73%$0.7045.75% 7.59%N/AAnalyst Report
News Coverage
The Hanover Insurance Group, Inc. stock logo
THG
The Hanover Insurance Group
$119.52
-0.6%
2.71%$3.2426.51% 7.69%N/AAnalyst Report
The Hershey Company stock logo
HSY
Hershey
$266.84
+0.1%
1.55%$4.1440.12% 9.02%5/18/2023Analyst Report
Insider Selling
The Home Depot, Inc. stock logo
HD
Home Depot
$295.16
+0.9%
2.83%$8.3650.00% 11.79%N/AEarnings Report
Dividend Announcement
Analyst Report
Analyst Revision
News Coverage
The Interpublic Group of Companies, Inc. stock logo
IPG
Interpublic Group of Companies
$38.41
+3.5%
3.23%$1.2439.87% 7.26%N/AAnalyst Report
Analyst Revision
News Coverage
The Kroger Co. stock logo
KR
Kroger
$49.33
+0.2%
2.11%$1.0423.16% 16.14%N/AAnalyst Report
The PNC Financial Services Group, Inc. stock logo
PNC
The PNC Financial Services Group
$120.15
+0.8%
4.99%$6.0043.73% 11.04%N/AAnalyst Report
The Southern Company stock logo
SO
Southern
$71.05
+0.2%
3.94%$2.8069.48% 3.15%N/AAnalyst Report
Analyst Revision
The Toro Company stock logo
TTC
Toro
$106.63
+2.1%
1.28%$1.3625.14% 10.26%N/AOptions Volume
The Travelers Companies, Inc. stock logo
TRV
Travelers Companies
$183.34
+0.9%
2.03%$3.7221.93% 4.35%6/8/2023
The York Water Company stock logo
YORW
York Water
$43.09
-0.4%
1.88%$0.8150.94% 3.99%6/29/2023Analyst Report
Thomson Reuters Co. stock logo
TRI
Thomson Reuters
$125.61
+1.7%
1.56%$1.9652.97% 7.32%N/AAnalyst Report
THOR Industries, Inc. stock logo
THO
THOR Industries
$81.84
+0.7%
2.20%$1.8024.62% 3.66%N/AAnalyst Report
Timberland Bancorp, Inc. stock logo
TSBK
Timberland Bancorp
$23.36
+0.7%
3.94%$0.92N/A 13.62%N/AAnalyst Report
TowneBank stock logo
TOWN
TowneBank
$22.93
+0.1%
4.01%$0.9240.00% 8.33%N/AAnalyst Report
Tractor Supply stock logo
TSCO
Tractor Supply
$230.56
+2.5%
1.79%$4.1235.61% 39.35%5/26/2023Dividend Announcement
Analyst Report
Insider Selling
Analyst Revision
Trinity Industries, Inc. stock logo
TRN
Trinity Industries
$21.37
+0.6%
4.87%$1.0458.43% 10.72%7/13/2023Analyst Report
Analyst Revision
Tyson Foods, Inc. stock logo
TSN
Tyson Foods
$49.97
-0.3%
3.84%$1.9254.08% 5.74%5/31/2023Dividend Announcement
Analyst Report
Insider Buying
U.S. Bancorp stock logo
USB
U.S. Bancorp
$30.49
+0.1%
6.30%$1.9240.08% 5.97%N/A
UDR, Inc. stock logo
UDR
UDR
$40.23
-0.8%
4.18%$1.68270.97% 3.52%N/AAnalyst Report
UMB Financial Co. stock logo
UMBF
UMB Financial
$59.92
+0.9%
2.54%$1.5220.00% 7.18%6/9/2023Analyst Report
Union Pacific Co. stock logo
UNP
Union Pacific
$198.81
0.0%
2.62%$5.2042.24% 11.14%N/ADividend Announcement
Analyst Report
United Bancorp, Inc. stock logo
UBCP
United Bancorp
$11.82
-1.9%
5.59%$0.6638.82% 4.67%6/8/2023Gap Up
United Parcel Service, Inc. stock logo
UPS
United Parcel Service
$171.04
-0.2%
3.79%$6.4854.73% 16.55%N/AAnalyst Report
UnitedHealth Group Incorporated stock logo
UNH
UnitedHealth Group
$479.23
-1.2%
1.38%$6.6023.45% 15.63%N/AAnalyst Report
Analyst Revision
Unum Group stock logo
UNM
Unum Group
$46.42
+1.0%
2.84%$1.3217.19% 4.95%N/AAnalyst Report
Verizon Communications Inc. stock logo
VZ
Verizon Communications
$36.13
-0.1%
7.22%$2.6155.53% 2.01%N/AAnalyst Report
Visa Inc. stock logo
V
Visa
$233.60
+0.4%
0.77%$1.8018.39% 14.47%N/AAnalyst Report
Vulcan Materials stock logo
VMC
Vulcan Materials
$196.41
-0.1%
0.88%$1.7222.02% 8.87%5/25/2023Dividend Announcement
Analyst Report
W. R. Berkley Co. stock logo
WRB
W. R. Berkley
$57.54
+0.2%
0.70%$0.407.16% 10.49%N/AAnalyst Report
Washington Federal, Inc. stock logo
WAFD
Washington Federal
$26.59
-0.9%
3.76%$1.0028.09% 5.39%5/18/2023Analyst Report
Analyst Revision
Washington Trust Bancorp, Inc. stock logo
WASH
Washington Trust Bancorp
$24.82
+2.2%
9.02%$2.2472.96% 2.91%N/AAnalyst Upgrade
News Coverage
Waste Connections, Inc. stock logo
WCN
Waste Connections
$139.44
-0.8%
0.73%$1.0221.43% 12.43%N/AAnalyst Report
Waste Management, Inc. stock logo
WM
Waste Management
$165.00
-1.0%
1.70%$2.8041.48% 8.24%6/1/2023Analyst Report
Watsco, Inc. stock logo
WSO
Watsco
$340.42
+1.7%
2.88%$9.8066.85% 10.14%N/AAnalyst Report
WD-40 stock logo
WDFC
WD-40
$191.99
+0.5%
1.73%$3.3258.55% 8.24%N/AAnalyst Report
WEC Energy Group, Inc. stock logo
WEC
WEC Energy Group
$89.34
+0.1%
3.49%$3.1263.54% 18.73%N/AAnalyst Upgrade
Analyst Revision
WesBanco, Inc. stock logo
WSBC
WesBanco
$24.04
+4.0%
5.82%$1.4050.00% 3.38%N/AAnalyst Report
High Trading Volume
Westlake Co. stock logo
WLK
Westlake
$117.13
+1.0%
1.21%$1.4211.71% 8.49%5/22/2023Dividend Announcement
Analyst Report
Whirlpool Co. stock logo
WHR
Whirlpool
$133.65
+3.1%
5.24%$7.0039.35% 13.80%5/18/2023Analyst Report
Williams-Sonoma, Inc. stock logo
WSM
Williams-Sonoma
$118.10
+2.8%
3.05%$3.6025.14% 17.57%N/AUpcoming Earnings
Analyst Report
Wintrust Financial Co. stock logo
WTFC
Wintrust Financial
$66.39
+0.9%
2.41%$1.6017.19% 10.79%N/AAnalyst Upgrade
Positive News
Worthington Industries, Inc. stock logo
WOR
Worthington Industries
$57.55
+1.2%
2.15%$1.2425.51% 8.40%6/14/2023Analyst Report
Xcel Energy Inc. stock logo
XEL
Xcel Energy
$65.87
-0.3%
3.16%$2.0857.46% 6.38%N/A
Xylem Inc. stock logo
XYL
Xylem
$104.43
+0.5%
1.26%$1.3235.68% 7.72%N/AAnalyst Report

Key Points

  • Investing in dividend-paying stocks is a good way to shield your portfolio from market volatility. 
  • One way to define the quality of a dividend stock is to assess the company’s ability to increase its dividend payout over time.  
  • Dividend Contenders are companies that have increased their dividend for 10 to 24 consecutive years.  

Investing in dividend-paying stocks is an easy way to shield your portfolio from market volatility. But the list of dividend stocks is long, and only some may fit your portfolio long-term. This article looks at a select group of stocks known as Dividend Contenders. We'll explain what that term means and why these are good choices when combining income and growth into your portfolio. 

Overview of Dividend Contenders

A dividend is a portion of a company's earnings that it pays out to shareholders. For example, Nike Inc. (NYSE: NKE) is a Dividend Contender. As of January 18, 2023, Nike pays out $1.36 per dividend share. Since the company issues its dividend quarterly, shareholders receive 34 cents per share every quarter (34 x 4 =136). An investor who owns 100 shares of Nike stock would receive $136 in dividends yearly. 

Dividend Contenders have increased their dividend for 10 to 24 consecutive years. The only requirement for a company to be a Dividend Contender is dividend growth. For other distinctions, such as the Dividend Aristocrats, a company must meet additional requirements in addition to increasing its dividend.  

One of the benefits of investing in Dividend Contenders is that once companies commit to not only paying but increasing dividends, they typically go to great lengths to keep such streaks intact. Stocks that pay dividends, particularly those of companies with a streak of raising dividends, catch the eye of income-oriented investors. 

Many companies, such as Nike, are mature in their business cycle. They still have growth opportunities, but they generate significant earnings that exceed the amount they need to reinvest in their business. 

Although earnings growth is bullish for a stock, shareholders don't like to see companies with too much excess cash on the sidelines. Companies use dividends to increase shareholder equity. Think of it as a bonus for owning the stock in a bull market and an incentive to keep holding it in a bear market. 

dividend contenders

Dividend Contenders vs. Dividend Champions

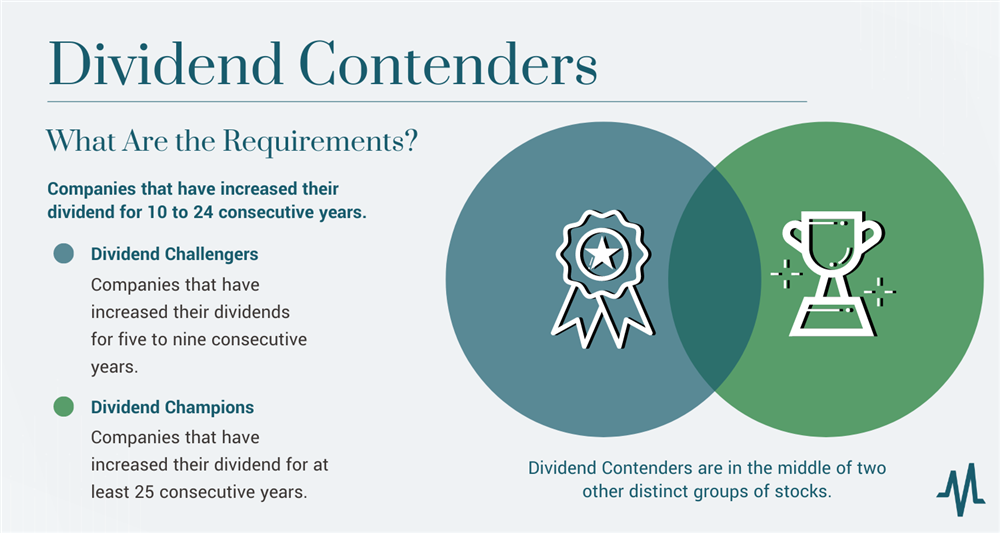
Dividend Contenders are in the middle of two other distinct groups of stocks:

  • Dividend Challengers: Dividend Challengers are companies that have increased their dividends for five to nine consecutive years.
  • Dividend Contenders: Dividend Contenders are companies that have increased their dividend for 10 to 24 consecutive years. 
  • Dividend Champions: Dividend Champions are companies that have increased their dividend for at least 25 consecutive years. 

Once a company has become a Dividend Contender, it is no longer on the list of Dividend Challengers. Once a company is a Dividend Champion, they are no longer on the list of Dividend Contenders. 

These are not the only categories of elite dividend stocks. MarketBeat is a good resource for you to find out more about how to invest in the Dividend Aristocrats or why you may want to invest in Dividend Achievers

Example of a High-Quality Dividend Contender

An example of a Dividend Contender is The Southern Company (NYSE: SO). The company has a payout ratio of over 88%. That's exceptionally high, but consistent earnings support it. That means barring a disruption in the company's core rail business, it can support its dividend and can grow. 

In general, stocks that pay dividends represent quality companies. With that said, Dividend Contenders already stand out because they have a history of paying and growing their dividends. 

To earn a dividend, you have to be a shareholder of record on what is known as the record date. When the time comes to receive dividends, the cash automatically gets reinvested into your account (in the form of more shares or partial shares) or gets paid directly to you. 

A company's board of directors must approve dividends and announce plans to investors. At the time of the dividend announcement, the company will announce a few key dates: the announcement date, the record date, the ex-dividend date, and the payment date. Let's take a quick look at the definitions of each:

  • Announcement date: The announcement date is when the company announces its plans to release a dividend payment.
  • Record date: As of the record date, shareholders will receive the dividend payment.
  • Payment date: The payment date is the official day you, the investor, will receive a dividend payment.

Many investors ask about the ex-dividend date in investing. Ex-dividend means "without the dividend." When a stock sells ex-dividend, it trades without the dividend added to its stock price. A simple example can help explain this:

Company A's stock sells for $150 per share and announces a $5 annual dividend paid in quarterly installments. On the ex-dividend date (see below), at the opening of trading, Company A's stock will be marked down by $1.25 ($5/$4 = $1.25).

Any investor buying stock on the ex-dividend date will purchase it at the current price minus the dividend amount. However, you will only be able to receive the upcoming dividend if you were a shareholder of record before the ex-dividend date.

So how do you use all of this to find a high-quality dividend contender? Some investors might look for the highest dividend stocks. It may be tricky because what constitutes a high dividend can be misleading. 

For example, some investors will look for stocks with the highest dividend yield. But this is problematic because a company can calculate its dividend yield by dividing its current annual dividend payout per share by its current stock price. 

These are two variables that can change frequently. When one or both fall, it can significantly impact the yield. And if the reason for that drop is due to a fundamental problem with the company, an investor may find themselves in a yield trap which may cause them to have to sell the stock for a loss. 

Therefore, a better way to find high-quality Dividend Contenders involves monitoring their dividend payout ratio. The dividend payout ratio tells you how much of a company's profits pay out in the form of a dividend. When you compare one company's dividend payout ratio to its current and projected earnings, you can see how sustainable the dividend payout is over time. 

Where to Find Dividend Contenders

A simple internet search will provide you with a complete list of Dividend Contenders. 

However, now that you know the criteria (i.e., 10 to 24 consecutive years of dividend growth), you can quickly determine if a stock is a Dividend Contender directly from MarketBeat.com. Going to the "dividend" tab for a company can show you whether or not it has increased its dividend and for the number of consecutive years. 

Dividend Contenders Sector Breakdown

Dividend-paying stocks are defensive. That means the underlying companies are in businesses that are in demand no matter what is happening in the economy. 

So it should be no surprise that the financial sector has the largest representation of Dividend Contenders, and it's not even close. As of December 2022, there were 111 financial services companies among the dividend contenders. The second most companies came from the Industrials sector and the third sector was utilities.

But virtually every sector is represented in some fashion. Apple, Inc. (NASDAQ: AAPL) is included as a Dividend Contender from the technology sector. Other sectors include consumer cyclical, basic materials, consumer discretionary, real estate, communication services and energy. 

Market Capitalization of Dividend Contenders

As you might expect, the list of Dividend Contenders is heavily populated by large-cap companies (those companies with a market capitalization of over $10 billion). That's because these companies are most likely to be in a mature phase of their business cycles. 

However, the list of dividend contenders also includes mid-cap and small-cap stocks, or those that have a market cap of less than $100 million. 

Dividend Contenders Offer Opportunities

One of the criticisms of dividend stocks is that they can be too conservative and not provide the opportunity for capital growth. That is particularly true of Dividend Aristocrats and Dividend Kings that have increased their dividends for 25 and 50 consecutive years, respectively.

That makes Dividend Contenders an intriguing option for investors looking for growth and income. These companies are still reinvesting strongly in their businesses but prioritizing shareholder equity by issuing a dividend. 

However, it's important to note that companies can fall off this list. For example, The Walt Disney Company (NYSE: DIS) fell off in 2020 when it had to suspend its dividend due to the impact of the COVID-19 pandemic. But overall, these stocks are considered quality stocks for investors looking to buy and hold.  

FAQs

Take a look at a few frequently asked questions about Dividend Contenders.

What are Dividend Contenders?

Dividend Contenders are a select group of companies that have increased their dividends between 10 and 24 consecutive years. These companies include stocks from all market caps and sectors. 

How can I get $1,000 per month in dividends?

Some high-dividend REITs (real estate investment trusts) have dividend yields of over 10% and pay dividends monthly. You could get $1,000 per month in dividends with an investment of around $800,000. 

How do you decide on the top dividend stocks?

To find the top dividend stocks, you should consider companies with a sustainable dividend payout ratio and a history of not only paying but also growing their dividend over time. These companies will frequently prioritize shareholder equity, making them among the top dividend stocks. 

How often are dividends paid?

Most dividends pay out quarterly. But some companies pay dividends on a different schedule, including monthly, biannually and annually. Some companies, even those that pay quarterly dividends, will sometimes issue special dividends

More Dividend Resources from MarketBeat

My Account -