QQQ   337.27 (+1.86%)
AAPL   175.05 (+1.37%)
MSFT   318.52 (+1.44%)
META   246.85 (+1.80%)
GOOGL   122.83 (+1.65%)
AMZN   118.15 (+2.29%)
TSLA   176.89 (+1.74%)
NVDA   316.78 (+4.97%)
NIO   7.82 (-2.62%)
BABA   85.77 (-5.41%)
AMD   107.93 (+4.03%)
T   16.55 (-0.66%)
F   11.64 (+1.22%)
MU   67.57 (+4.08%)
CGC   1.05 (+0.00%)
GE   104.01 (+0.52%)
DIS   93.76 (+1.07%)
AMC   5.07 (-0.59%)
PFE   36.48 (-0.73%)
PYPL   61.27 (-0.31%)
NFLX   371.29 (+9.22%)

Dividend Challengers

Dividend Challengers are U.S. public companies that have raised their dividends for 5 or more consecutive years, but less than 10 years. Like the Dividend Champions list (25+ years of conescutive dividend growth) and Dividend Contenders list (10-24 years of consecutive growth), it was created by David Fish and is maintained by the DRIP Investing Resource Center, a non-profit investing resource organization.

Learn more about trading stocks based on dividends.

MarketRank evaluates a company based on community opinion, dividend strength, institutional and insider ownership, earnings and valuation, and analysts forecasts.
Available with a MarketBeat All Access Subscription
MarketRank™Upgrade to All Access to use the All Ranks Filter
Media sentiment refers to the percentage of positive news stories versus negative news stories a company has received in the past week.
Available with a MarketBeat All Access Subscription
Media SentimentUpgrade to All Access to use the All Sentiments Filter
Analyst consensus is the average investment recommendation among Wall Street research analysts.
Available with a MarketBeat All Access Subscription
Analyst ConsensusUpgrade to All Access to use the All Ratings Filter
CompanyCurrent PriceDividend YieldAnnual PayoutPayout Ratio3-Year Dividend GrowthEx-Dividend DateIndicator(s)
Acushnet Holdings Corp. stock logo
GOLF
Acushnet
$46.27
-0.9%
1.69%$0.7825.24% 8.74%6/1/2023Analyst Report
Insider Selling
Air Lease Co. stock logo
AL
Air Lease
$39.08
+0.4%
2.05%$0.8013.45% 11.82%6/5/2023Analyst Report
Albany International Corp. stock logo
AIN
Albany International
$91.03
+0.6%
1.10%$1.0023.70% 6.43%6/6/2023Dividend Announcement
Analyst Report
Alerus Financial Co. stock logo
ALRS
Alerus Financial
$14.86
+1.5%
4.85%$0.7243.11% 7.09%6/14/2023
Allegion plc stock logo
ALLE
Allegion
$110.49
+1.3%
1.63%$1.8025.10% 14.94%6/14/2023Analyst Report
Ally Financial Inc. stock logo
ALLY
Ally Financial
$27.28
+4.4%
4.40%$1.2024.29% 20.84%N/AAnalyst Report
Applied Materials, Inc. stock logo
AMAT
Applied Materials
$129.92
+3.4%
0.80%$1.0415.43% 7.38%5/24/2023Earnings Report
Analyst Report
News Coverage
Arbor Realty Trust, Inc. stock logo
ABR
Arbor Realty Trust
$12.81
+2.8%
12.49%$1.6087.91% 10.54%5/18/2023Analyst Report
Options Volume
Positive News
Ares Management Co. stock logo
ARES
Ares Management
$83.11
-0.1%
3.71%$3.0860.39% 23.99%6/15/2023Analyst Report
Insider Buying
Atlantica Sustainable Infrastructure plc stock logo
AY
Atlantica Sustainable Infrastructure
$25.67
-0.6%
6.93%$1.78254.29% 4.08%5/30/2023Analyst Report
Bankwell Financial Group, Inc. stock logo
BWFG
Bankwell Financial Group
$23.56
-0.8%
3.40%$0.8021.51% 15.44%N/AAnalyst Report
Barings BDC, Inc. stock logo
BBDC
Barings BDC
$7.80
+2.5%
12.82%$1.0085.47% 20.72%6/6/2023Insider Buying
Baxter International Inc. stock logo
BAX
Baxter International
$43.03
+0.6%
2.70%$1.1634.73% 10.60%6/1/2023Analyst Report
Analyst Revision
BWX Technologies, Inc. stock logo
BWXT
BWX Technologies
$66.54
-0.2%
1.38%$0.9228.84% 8.97%5/18/2023Analyst Report
Cable One, Inc. stock logo
CABO
Cable One
$677.26
+1.6%
1.68%$11.4020.70% 9.63%N/AAnalyst Report
Capital City Bank Group, Inc. stock logo
CCBG
Capital City Bank Group
$30.29
-1.2%
2.38%$0.7221.36% 11.20%N/AAnalyst Report
Capital Southwest Co. stock logo
CSWC
Capital Southwest
$18.09
+0.6%
11.72%$2.1287.60% 8.04%6/14/2023Upcoming Earnings
Analyst Upgrade
CareTrust REIT, Inc. stock logo
CTRE
CareTrust REIT
$19.37
-1.3%
5.78%$1.12107.69% 6.92%N/AAnalyst Upgrade
CDW Co. stock logo
CDW
CDW
$174.73
+0.9%
1.35%$2.3622.65% 18.22%5/24/2023Dividend Announcement
Analyst Report
Short Interest ↑
Cognex Co. stock logo
CGNX
Cognex
$52.20
+0.5%
0.54%$0.2820.59% 8.93%5/18/2023Analyst Report
Colony Bankcorp, Inc. stock logo
CBAN
Colony Bankcorp
$9.20
+0.3%
4.78%$0.4432.59% 12.75%N/AAnalyst Report
Community Healthcare Trust Incorporated stock logo
CHCT
Community Healthcare Trust
$34.15
-2.4%
5.27%$1.80159.29% 2.37%N/AAnalyst Report
News Coverage
Positive News
ConocoPhillips stock logo
COP
ConocoPhillips
$100.74
+0.0%
2.03%$2.0419.58% 12.29%6/26/2023Analyst Report
Short Interest ↓
Analyst Revision
Cousins Properties Incorporated stock logo
CUZ
Cousins Properties
$19.82
+0.2%
6.46%$1.28200.00% 3.34%N/AAnalyst Report
Analyst Revision
CRA International, Inc. stock logo
CRAI
CRA International
$97.66
-0.4%
1.47%$1.4423.04% 15.83%5/26/2023Analyst Report
Crown Castle Inc. stock logo
CCI
Crown Castle
$113.99
-0.4%
5.49%$6.26180.92% 9.31%6/14/2023Analyst Report
D.R. Horton, Inc. stock logo
DHI
D.R. Horton
$112.48
+0.2%
0.89%$1.008.78% 13.96%N/AAnalyst Report
Insider Selling
Danaher Co. stock logo
DHR
Danaher
$226.43
+0.5%
0.48%$1.0810.31% 13.72%6/29/2023Analyst Report
Diamondback Energy, Inc. stock logo
FANG
Diamondback Energy
$128.74
+0.9%
2.49%$3.2015.02% 59.70%N/AAnalyst Report
Analyst Revision
DICK'S Sporting Goods, Inc. stock logo
DKS
DICK'S Sporting Goods
$135.91
+0.3%
2.94%$4.0028.84% 21.03%N/AUpcoming Earnings
Analyst Report
Short Interest ↓
Analyst Revision
Dollar General Co. stock logo
DG
Dollar General
$217.83
+0.7%
1.08%$2.3618.93% 19.79%N/AAnalyst Report
Short Interest ↑
Eli Lilly and Company stock logo
LLY
Eli Lilly and
$437.89
+0.1%
1.03%$4.5237.92% 15.02%N/AAnalyst Report
Insider Selling
EnPro Industries, Inc. stock logo
NPO
EnPro Industries
$99.42
+2.0%
1.17%$1.1615.20% 3.85%5/30/2023Analyst Report
Positive News
Entergy Co. stock logo
ETR
Entergy
$101.50
-0.6%
4.22%$4.2859.53% 3.86%N/AShort Interest ↓
Analyst Revision
Enterprise Financial Services Corp stock logo
EFSC
Enterprise Financial Services
$40.25
+1.0%
2.48%$1.0018.80% 13.23%6/14/2023Analyst Report
Positive News
Enviva Inc. stock logo
EVA
Enviva
$8.50
-2.1%
42.59%$3.62-1,034.29% 10.99%N/A
EOG Resources, Inc. stock logo
EOG
EOG Resources
$112.02
+1.1%
2.95%$3.3025.48% 41.62%7/14/2023Analyst Report
Equinix, Inc. stock logo
EQIX
Equinix
$721.18
-1.0%
1.89%$13.64135.99% 8.01%5/23/2023Analyst Report
Exponent, Inc. stock logo
EXPO
Exponent
$88.87
+1.5%
1.17%$1.0445.22% 14.47%6/8/2023Analyst Downgrade
Farmers & Merchants Bancorp, Inc. stock logo
FMAO
Farmers & Merchants Bancorp
$20.43
+6.5%
4.11%$0.8442.64% 9.46%N/APositive News
Farmers National Banc Corp. stock logo
FMNB
Farmers National Banc
$11.69
+0.3%
5.82%$0.6844.44% 19.59%N/AAnalyst Report
Fidelity D & D Bancorp, Inc. stock logo
FDBC
Fidelity D & D Bancorp
$40.17
-2.1%
3.58%$1.44N/A 8.40%5/18/2023
First Commonwealth Financial Co. stock logo
FCF
First Commonwealth Financial
$12.72
+1.2%
3.93%$0.5031.25% 5.90%N/AAnalyst Report
First Financial Northwest, Inc. stock logo
FFNW
First Financial Northwest
$10.12
-0.8%
5.14%$0.5254.74% 11.10%6/8/2023Dividend Announcement
First National Co. stock logo
FXNC
First National
$14.67
-2.2%
4.09%$0.6029.70% 15.87%5/25/2023
FirstService Co. stock logo
FSV
FirstService
$147.00
-0.6%
0.61%$0.9017.14% 10.52%6/29/2023Analyst Report
FMC Co. stock logo
FMC
FMC
$108.47
+0.4%
2.14%$2.3226.19% 9.78%6/29/2023Analyst Report
Short Interest ↓
Analyst Revision
Four Corners Property Trust, Inc. stock logo
FCPT
Four Corners Property Trust
$25.80
-0.2%
5.27%$1.36119.30% 4.64%N/AAnalyst Report
News Coverage
Positive News
Genpact Limited stock logo
G
Genpact
$38.33
+1.2%
1.43%$0.5516.57% 13.72%6/8/2023Analyst Report
Insider Selling
High Trading Volume
Gilead Sciences, Inc. stock logo
GILD
Gilead Sciences
$78.21
-0.8%
3.84%$3.0041.72% 5.03%6/14/2023Analyst Upgrade
Analyst Revision
Gladstone Land Co. stock logo
LAND
Gladstone Land
$15.31
+0.5%
3.59%$0.55-183.33% 0.75%5/22/2023Analyst Report
Short Interest ↓
Global Water Resources, Inc. stock logo
GWRS
Global Water Resources
$11.28
+1.3%
2.66%$0.30103.45% 1.00%N/AAnalyst Report
Graham Holdings stock logo
GHC
Graham
$588.17
+0.9%
1.12%$6.609.81% 4.36%7/18/2023Analyst Report
Guaranty Bancshares, Inc. stock logo
GNTY
Guaranty Bancshares
$24.40
+1.5%
3.77%$0.92N/A 11.41%N/A
Hamilton Lane Incorporated stock logo
HLNE
Hamilton Lane
$67.42
+1.5%
2.37%$1.6035.96% 14.32%N/AUpcoming Earnings
News Coverage
Hannon Armstrong Sustainable Infrastructure Capital, Inc. stock logo
HASI
Hannon Armstrong Sustainable Infrastructure Capital
$25.79
-0.1%
6.13%$1.5865.83% 3.83%7/3/2023Analyst Report
Positive News
Heartland Financial USA, Inc. stock logo
HTLF
Heartland Financial USA
$28.92
+0.7%
4.15%$1.2024.74% 17.03%N/AAnalyst Report
Positive News
Hess Midstream LP stock logo
HESM
Hess Midstream
$27.54
0.0%
8.50%$2.3495.51% 11.84%N/AHigh Trading Volume
Hilltop Holdings Inc. stock logo
HTH
Hilltop
$31.90
+0.3%
2.01%$0.6438.10% 23.31%N/AAnalyst Report
Home Federal Bancorp, Inc. of Louisiana stock logo
HFBL
Home Federal Bancorp, Inc. of Louisiana
$16.35
2.94%$0.48N/A 13.62%N/AShort Interest ↓
Positive News
Hooker Furnishings Co. stock logo
HOFT
Hooker Furnishings
$16.43
-0.1%
5.36%$0.8869.29% 10.36%N/AAnalyst Report
Houlihan Lokey, Inc. stock logo
HLI
Houlihan Lokey
$88.85
-0.7%
2.39%$2.1243.35% 18.96%6/1/2023Analyst Report
Analyst Revision
Independent Bank Co. stock logo
IBCP
Independent Bank
$16.95
+0.1%
5.43%$0.9237.25% 6.92%N/AAnalyst Report
Independent Bank Group, Inc. stock logo
IBTX
Independent Bank Group
$34.31
-0.3%
4.43%$1.5236.10% 14.98%N/AAnalyst Report
High Trading Volume
Innovative Industrial Properties, Inc. stock logo
IIPR
Innovative Industrial Properties
$70.65
+0.4%
10.19%$7.20126.32% 35.88%N/AAnalyst Report
News Coverage
Intercontinental Exchange, Inc. stock logo
ICE
Intercontinental Exchange
$108.55
0.0%
1.55%$1.6827.91% 11.38%6/14/2023Analyst Report
Short Interest ↓
Investar Holding Co. stock logo
ISTR
Investar
$11.48
-2.3%
3.31%$0.3823.75% 17.05%N/AAnalyst Report
Positive News
Invitation Homes Inc. stock logo
INVH
Invitation Homes
$33.54
-0.2%
3.10%$1.04138.67% 19.17%N/A
John B. Sanfilippo & Son, Inc. stock logo
JBSS
John B. Sanfilippo & Son
$112.04
-0.2%
0.67%$0.7514.59% 7.72%5/31/2023Analyst Report
Positive News
Johnson Outdoors Inc. stock logo
JOUT
Johnson Outdoors
$62.48
+0.2%
1.98%$1.2421.02% 25.31%N/AAnalyst Report
Positive News
Kilroy Realty Co. stock logo
KRC
Kilroy Realty
$26.83
-0.2%
8.05%$2.16141.18% 3.54%N/AAnalyst Report
Short Interest ↑
Kinder Morgan, Inc. stock logo
KMI
Kinder Morgan
$16.52
+0.4%
6.84%$1.1394.96% 5.09%N/AAnalyst Report
Kinsale Capital Group, Inc. stock logo
KNSL
Kinsale Capital Group
$323.81
+0.4%
0.17%$0.564.60% 17.57%5/30/2023Dividend Announcement
Analyst Report
Analyst Revision
Kinsale Capital Group, Inc. stock logo
KNSL
Kinsale Capital Group
$323.81
+0.4%
0.17%$0.564.60% 17.57%5/30/2023Dividend Announcement
Analyst Report
Analyst Revision
Lam Research Co. stock logo
LRCX
Lam Research
$598.74
+4.3%
1.15%$6.9026.97% 12.75%6/13/2023Dividend Announcement
Analyst Report
Short Interest ↓
Landmark Bancorp, Inc. stock logo
LARK
Landmark Bancorp
$20.50
+1.4%
4.10%$0.84N/A 6.72%N/AAnalyst Report
Short Interest ↓
Landstar System, Inc. stock logo
LSTR
Landstar System
$178.60
+0.4%
0.67%$1.2012.83% 16.26%N/AAnalyst Report
Analyst Revision
LCI Industries stock logo
LCII
LCI Industries
$114.53
-0.1%
3.67%$4.2041.22% 16.67%N/AAnalyst Report
Positive News
LCNB Corp. stock logo
LCNB
LCNB
$14.95
-4.5%
5.62%$0.8459.15% 5.49%5/31/2023Analyst Report
News Coverage
Logitech International S.A. stock logo
LOGI
Logitech International
$63.77
+0.4%
N/AN/A0.00%N/AN/AAnalyst Report
News Coverage
Louisiana-Pacific Co. stock logo
LPX
Louisiana-Pacific
$63.34
+1.1%
1.52%$0.9623.13% 17.68%N/AAnalyst Revision
Martin Marietta Materials, Inc. stock logo
MLM
Martin Marietta Materials
$407.82
+0.1%
0.65%$2.6414.27% 7.23%5/31/2023Dividend Announcement
Analyst Report
Medical Properties Trust, Inc. stock logo
MPW
Medical Properties Trust
$7.78
+2.1%
14.91%$1.16116.00% 4.38%6/14/2023Analyst Report
Positive News
Mercantile Bank Co. stock logo
MBWM
Mercantile Bank
$26.49
+1.0%
4.98%$1.3234.46% 5.93%6/1/2023Analyst Report
Merchants Bancorp stock logo
MBIN
Merchants Bancorp
$24.28
+2.0%
1.32%$0.326.72% 14.47%N/AShort Interest ↓
News Coverage
MetLife, Inc. stock logo
MET
MetLife
$51.88
+0.3%
4.01%$2.0822.76% 4.40%N/AAnalyst Report
Midland States Bancorp, Inc. stock logo
MSBI
Midland States Bancorp
$19.88
-0.4%
6.04%$1.2037.74% 6.14%N/AAnalyst Report
Positive News
Monolithic Power Systems, Inc. stock logo
MPWR
Monolithic Power Systems
$431.47
+3.8%
0.93%$4.0029.13% 23.31%N/AAnalyst Report
Mplx Lp stock logo
MPLX
Mplx
$34.20
+0.6%
9.06%$3.1082.23% 2.93%N/AAnalyst Report
MSCI Inc. stock logo
MSCI
MSCI
$472.25
+2.4%
1.17%$5.5237.55% 22.04%N/AAnalyst Report
Mueller Water Products, Inc. stock logo
MWA
Mueller Water Products
$13.81
+1.4%
1.74%$0.2430.77% 4.66%N/AAnalyst Report
MVB Financial Corp. stock logo
MVBF
MVB Financial
$17.39
-1.3%
3.91%$0.6822.97% 51.64%5/31/2023
National Instruments Co. stock logo
NATI
National Instruments
$58.06
+0.2%
1.93%$1.1239.44% 3.85%N/AInsider Selling
National Storage Affiliates Trust stock logo
NSA
National Storage Affiliates Trust
$37.19
-0.5%
5.92%$2.20229.17% 19.18%N/AAnalyst Report
Positive News
Nelnet, Inc. stock logo
NNI
Nelnet
$94.90
-0.9%
1.10%$1.0417.33% 9.82%5/31/2023Analyst Report
NexPoint Residential Trust, Inc. stock logo
NXRT
NexPoint Residential Trust
$41.13
+0.6%
4.08%$1.68-409.76% 11.10%6/14/2023Analyst Report
Positive News
NextEra Energy Partners, LP stock logo
NEP
NextEra Energy Partners
$59.39
-0.3%
5.67%$3.37124.35% 14.97%N/AAnalyst Report
NiSource Inc. stock logo
NI
NiSource
$27.36
-0.3%
3.65%$1.0059.52%N/AN/AAnalyst Report
Norwood Financial Corp. stock logo
NWFL
Norwood Financial
$25.98
-0.6%
4.46%$1.16N/A 5.22%N/AAnalyst Report
News Coverage
Oak Valley Bancorp stock logo
OVLY
Oak Valley Bancorp
$23.47
+1.1%
1.36%$0.32N/A 3.57%N/AAnalyst Report
High Trading Volume
ONE Gas, Inc. stock logo
OGS
ONE Gas
$79.72
-0.2%
3.26%$2.6060.47% 7.43%N/AAnalyst Report
Analyst Revision
Positive News
Open Text Co. stock logo
OTEX
Open Text
$41.54
+1.6%
2.34%$0.9721.00% 11.15%6/1/2023
Owens Corning stock logo
OC
Owens Corning
$111.62
+2.3%
1.86%$2.0818.44% 20.38%N/AAnalyst Report
Analyst Revision
Park National Co. stock logo
PRK
Park National
$104.43
-0.6%
4.02%$4.2056.30% 0.98%5/18/2023Analyst Downgrade
Park National Co. stock logo
PRK
Park National
$104.43
-0.6%
4.02%$4.2056.30% 0.98%5/18/2023Analyst Downgrade
PCB Bancorp stock logo
PCB
PCB Bancorp
$14.31
+0.8%
5.03%$0.7233.96% 33.89%N/A
Peoples Bancorp Inc. stock logo
PEBO
Peoples Bancorp
$25.09
+1.1%
6.22%$1.5643.09% 4.35%N/AAnalyst Report
Peoples Financial Services Corp. stock logo
PFIS
Peoples Financial Services
$39.50
4.15%$1.6436.53% 4.87%5/30/2023Analyst Upgrade
Insider Buying
News Coverage
Power Integrations, Inc. stock logo
POWI
Power Integrations
$85.11
+3.9%
0.89%$0.7626.48% 27.18%5/30/2023Analyst Report
PulteGroup, Inc. stock logo
PHM
PulteGroup
$70.15
+0.9%
0.91%$0.647.06% 10.67%6/16/2023Analyst Report
Options Volume
Regency Centers Co. stock logo
REG
Regency Centers
$58.24
-0.9%
4.46%$2.60121.50% 2.57%6/13/2023Dividend Announcement
Analyst Report
News Coverage
High Trading Volume
Restaurant Brands International Inc. stock logo
QSR
Restaurant Brands International
$73.36
+0.5%
3.00%$2.2064.71% 2.60%6/21/2023
Rexford Industrial Realty, Inc. stock logo
REXR
Rexford Industrial Realty
$54.21
-0.1%
2.80%$1.52117.83% 19.41%6/29/2023
Ritchie Bros. Auctioneers Incorporated stock logo
RBA
Ritchie Bros. Auctioneers
$54.25
+4.6%
1.99%$1.0838.43% 11.02%5/26/2023Analyst Downgrade
Insider Buying
Positive News
Gap Up
Selective Insurance Group, Inc. stock logo
SIGI
Selective Insurance Group
$101.47
-0.5%
1.18%$1.2016.00% 11.16%N/AAnalyst Report
ServisFirst Bancshares, Inc. stock logo
SFBS
ServisFirst Bancshares
$45.52
-0.8%
2.46%$1.1228.28% 15.78%N/AAnalyst Upgrade
Shoe Carnival, Inc. stock logo
SCVL
Shoe Carnival
$23.51
-1.4%
1.70%$0.409.17% 29.05%N/AUpcoming Earnings
Analyst Report
News Coverage
Silvercrest Asset Management Group Inc. stock logo
SAMG
Silvercrest Asset Management Group
$18.90
+1.0%
3.81%$0.7240.22% 5.27%6/8/2023Analyst Report
Positive News
Sirius XM Holdings Inc. stock logo
SIRI
Sirius XM
$3.63
2.75%$0.1031.25% 22.00%N/AAnalyst Report
Analyst Revision
Skyworks Solutions, Inc. stock logo
SWKS
Skyworks Solutions
$102.11
+3.0%
2.43%$2.4826.11% 12.90%5/26/2023Analyst Report
STAG Industrial, Inc. stock logo
STAG
STAG Industrial
$34.43
+0.3%
4.27%$1.47201.37% 0.69%5/30/2023Analyst Report
Stifel Financial Corp. stock logo
SF
Stifel Financial
$58.96
+0.0%
2.44%$1.4419.25% 44.22%5/31/2023Analyst Report
Insider Selling
Summit Financial Group, Inc. stock logo
SMMF
Summit Financial Group
$19.19
+0.4%
4.17%$0.8019.51% 8.81%N/AAnalyst Report
Sun Communities, Inc. stock logo
SUI
Sun Communities
$127.85
-2.1%
2.91%$3.72136.26% 5.47%N/AAnalyst Report
Positive News
Taitron Components Incorporated stock logo
TAIT
Taitron Components
$3.96
+2.7%
5.05%$0.20N/A 13.96%N/AUpcoming Earnings
Analyst Report
News Coverage
Negative News
High Trading Volume
Tetra Tech, Inc. stock logo
TTEK
Tetra Tech
$143.39
+1.0%
0.64%$0.9216.17% 16.01%5/23/2023Analyst Revision
News Coverage
The First Bancshares, Inc. stock logo
FBMS
First Bancshares
$25.85
+0.9%
3.40%$0.8827.08% 33.65%N/AAnalyst Report
Short Interest ↓
The New York Times Company stock logo
NYT
New York Times
$36.48
-0.6%
1.21%$0.4430.56% 21.64%N/A
The Williams Companies, Inc. stock logo
WMB
Williams Companies
$29.21
+0.9%
6.13%$1.79100.00% 3.80%6/9/2023Analyst Upgrade
Thermo Fisher Scientific Inc. stock logo
TMO
Thermo Fisher Scientific
$523.54
+0.4%
0.27%$1.405.26% 16.45%N/AAnalyst Report
Analyst Revision
TTEC Holdings, Inc. stock logo
TTEC
TTEC
$33.71
+2.8%
3.09%$1.0436.24% 18.05%N/AAnalyst Report
Union Bankshares, Inc. stock logo
UNB
Union Bankshares
$22.00
+6.3%
6.55%$1.44N/A 4.13%N/AAnalyst Report
Positive News
Gap Up
United Community Banks, Inc. stock logo
UCBI
United Community Banks
$23.01
+1.1%
4.00%$0.9233.58% 8.14%N/AAnalyst Report
Positive News
Unitil Co. stock logo
UTL
Unitil
$55.77
-0.6%
2.90%$1.6255.48% 1.77%N/AEx-Dividend
Analyst Report
Universal Display Co. stock logo
OLED
Universal Display
$150.49
-1.2%
0.93%$1.4028.87% 44.22%6/15/2023Analyst Report
Virtus Investment Partners, Inc. stock logo
VRTS
Virtus Investment Partners
$183.24
+2.6%
3.60%$6.6025.20% 37.19%N/AAnalyst Report
Walker & Dunlop, Inc. stock logo
WD
Walker & Dunlop
$73.07
+1.5%
3.45%$2.5240.84% 25.99%N/AAnalyst Downgrade
William Penn Bancorporation stock logo
WMPN
William Penn Bancorporation
$9.80
+1.2%
1.22%$0.12N/AN/AN/A
Wingstop Inc. stock logo
WING
Wingstop
$204.10
+0.4%
0.37%$0.7631.02% 21.64%5/18/2023Analyst Report
Yum! Brands, Inc. stock logo
YUM
Yum! Brands
$138.45
+0.9%
1.75%$2.4240.88% 10.72%N/AAnalyst Report
Insider Selling
Zions Bancorporation, National Association stock logo
ZION
Zions Bancorporation, National Association
$27.24
+4.1%
6.02%$1.6481.19%N/AN/AAnalyst Report
Zoetis Inc. stock logo
ZTS
Zoetis
$179.72
+0.4%
0.83%$1.5024.79% 24.95%7/20/2023Dividend Announcement
Analyst Report

Key Points

  • Dividend Challengers are companies that have increased their dividends for the last five to 10 years.
  • Investors often choose to invest in Dividend Challengers to create a passive income stream.
  • While Dividend Challengers may offer a unique mix of value and growth potential, it's important to remember that no stock can guarantee future increases in dividend returns.

What is a Dividend Challenger, and should you add these stocks to your portfolio? A Dividend Challenger is a share of stock issued by an underlying corporation that has increased its dividend payment for the last five years. Dividend Champions, Contenders and Challengers are all terms that investors can use to classify stocks based on past income distributions and future earning potential. 

Dividend Challengers provide investors with a unique opportunity to enter the market at a lower initial investment price when compared to dividend aristocrats. However, there are a few important considerations investors will need to note before researching Dividend Challengers. 

Read on to learn more about Dividend Challengers, access a Dividend Challengers list and place your first buy order. 

What is a Dividend Challenger?

Before fully discussing what a Dividend Challenger is and why you should look for companies that pay a dividend, it's essential to understand what a dividend is and when you earn them. A dividend is a small portion of a company's profits distributed to shareholders, usually in the form of a cash deposit directly to the shareholders' brokerage accounts. Corporations may distribute dividends to investors to encourage them to hold their stock or as a return on the initial investment.

Companies with excess cash on hand may choose to pay dividends to distribute that cash to shareholders rather than keeping it on the balance sheet. In some cases, distributing dividends may also come with tax advantages for the company issuing the dividends.

Few companies are required to pay dividends. Many investors are surprised to learn that major blue-chip corporations like Amazon.com Inc. (NASDAQ: AMZN) do not pay dividends despite record-breaking profits. Blue-chip companies with steady cash flow and a solid investor base may not need to pay dividends to improve liquidity. Issuing dividends is a way to reward older investors and demonstrate financial strength.

what are dividend challengers

Understanding Dividend Challengers

Increasing a dividend over time is one way to demonstrate that a company's dividend is sustainable. As profits increase, companies that have put dividends into place may want to increase them over time as a signal to investors that continued growth is sustainable. A history of growing dividends may also help investors identify value stocks poised to increase in value over time or that are currently undervalued.

Many investors look at dividend history before selecting which companies to add to a passive income portfolio, which helps them avoid dividend traps and companies that have increased dividends to unsustainable levels.  

Dividend Challengers attempt to attract investors by showcasing financial strength. A company that consistently raises its dividends signals to the market that it is financially healthy and has a stable and predictable cash flow. This can increase the company's stock demand, driving up the share price. Companies that continue increasing dividends also see less volatile stock price movements, which can help stabilize cash flow. Dividend Challengers provide a tangible return on investment, which can also attract a new class of investors.

While you can screen dividends for investments using a stock screener, most screeners only display the most recent dividend yield. Dividend Challengers may represent the ideal balance of value and distributions for new investors learning more about growth stocks.

Examples of Dividend Challengers

There are hundreds of Dividend Challengers, and the list is growing and changing every year. Some examples of current Dividend Challengers include the following:

  • Ally Financial: Ally Financial Inc. (NYSE: ALLY) is a financial services company based in the United States. The company provides a range of financial products and services, including online banking, auto financing, insurance, investment services and mortgage loans and is one of the country's largest online banks. Ally has increased its dividend by 20.84% over the last three years. 
  • Equinix: Equinix Inc. (NASDAQ: EQIX) is a global data center and interconnection company providing business storage and cloud services. The company's colocation services allow businesses to rent physical space within Equinix's data centers and deploy IT equipment. The company's interconnection services enable enterprises to connect to other companies and networks within the Equinix ecosystem. Equinix has increased its dividend by more than 8% in the last three years. 
  • MetLife: MetLife Inc. (NYSE: MET) is a global financial services company that provides a range of insurance, annuities, employee benefits, and asset management services. MetLife is one of the largest insurance companies in the world, with operations across North America, Europe and Asia. Over the past three years, MetLife has increased its dividend by 4.4%. 
  • Sirius XM: Sirius XM Holdings Inc. (NASDAQ: SIRI) is a satellite radio and audio entertainment company that offers commercial-free radio programs on a subscription basis. Sirius channels provide listeners access to music, comedy, sports commentary channels and other audio entertainment through satellite connections with cars, mobile devices and more. Over the past three years, Sirius XM increased its dividend by 22%. 

Pros and Cons of Investing in Dividend Challengers

While investing in Dividend Challengers is a universally good choice, there are a few drawbacks you'll want to consider before selecting which stocks to buy. 

Pros

Look at the benefits of investing in Dividend Challengers:

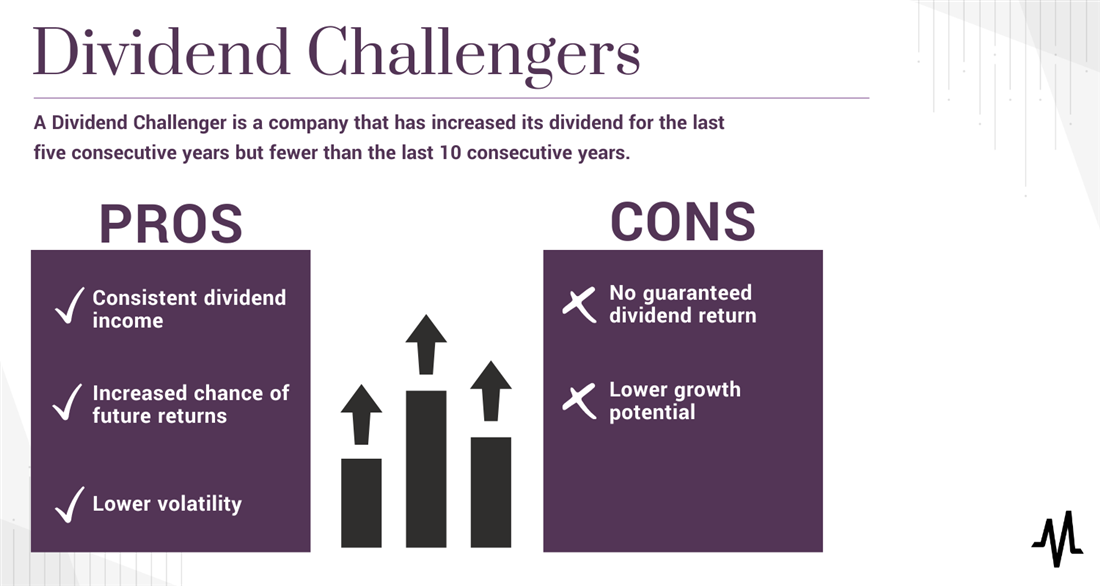
  • Consistent dividend income: Perhaps the most popular reason to invest in Dividend Challengers or explore our Dividend Kings list on MarketBeat is that companies that offer dividends can provide a passive income stream, offering an immediate return on investment for stock owners, which can help offset the initial investment cost.
  • Increased chance of future returns: Companies that have increased their dividend multiple years in a row may do so as a way to demonstrate their financial strength. Investing in Dividend Challengers gives you a higher chance of seeing increased returns in the future, which you can calculate when you consider your buy-in price.
  • Lower volatility: Dividend stocks, including Dividend Challengers, typically show less volatility than companies that do not have a history of distributions. This is because companies with a history of dividend increases are usually more established and financially stable, making them attractive choices for long-term investors. 

Cons

What about the downsides?

  • No guaranteed dividend return: Very few companies are required to pay out dividends to investors — and even the best dividend stocks might have to cut dividends in times of economic downturn. Just because a stock is currently a Dividend Challenger does not mean you are guaranteed to see higher dividend returns in the future.
  • Lower growth potential: Dividend Challengers may not offer the same potential for growth as smaller, high-growth companies just getting started on the market. Smaller companies that cannot yet afford dividends may show more growth potential, giving you a bigger overall return. This can limit the upside potential for capital appreciation on stocks already paying a consistent dividend. 

Dividend Achievers vs. Dividend Challengers

Dividend Achievers are similar to Dividend Challengers because they are companies that showcase solid financial histories and track records on the market. Dividend Achievers, like Challengers, also look to attract investors by increasing their dividends year after year. However, Dividend Achievers have increased their dividends for at least 10 consecutive years. This means that a Dividend Challenger can eventually be upgraded to an Achiever if it grows its dividend at least once annually.

Some examples of Dividend Achievers include:

You can view a complete Dividend Achievers list here to explore investment options.  

Dividend Contenders vs. Dividend Challengers

Like Dividend Challengers, Dividend Contenders aim to attract investors by offering steadily increasing dividends. Contenders are stronger than Challengers and Achievers alike, having increased their dividends for the last 10 to 25 years. Contenders are in the later stages of developing a growth path and often have higher entry prices per share.

Some examples of current Dividend Contenders include:

Dividend Contenders and Challengers can be attractive investments for dividend-focused investors, but they may appeal to different investing strategies. Contenders are typically larger and more established companies that may offer more stable dividend growth. In comparison, Challengers are often smaller and more dynamic companies that may offer higher potential for capital appreciation and dividend growth. 

Check out MarketBeat's Dividend Aristocrats list to learn about companies issuing consistent dividends. 

Investing with Dividends

Many investors are attracted to the immediate returns of dividend investing. Investing in Dividend Challengers is a way to avoid dividend traps, but it's important to remember that no company can guarantee future increased returns. Be sure to review as much dividend history as possible before investing, so you're setting yourself up with investments that are more likely to provide consistent returns. 

FAQs

Ready to learn more about Dividend Challengers and Achievers? Read on to learn the answers to some of the most common questions new investors have about dividend investors. 

What is a Dividend Challenger?

A Dividend Challenger is a company that has increased its dividend for the last five consecutive years but fewer than the last 10 consecutive years. Dividend Challengers allow investors to add a passive income stream with a comparatively lower initial investment. David Fish created the concept of a Dividend Challenger, and the DRIP Investing Resource Center maintains a list of Dividend Challengers currently trading on the market.

How many Dividend Challengers are there?

There are currently more than 200 companies on David Fish's official list of Dividend Challengers. You can find a list of MarketBeat Dividend Challengers and a list of MarketBeat Dividend Achievers

Why are the Dividend Challengers important?

Dividend Challengers are important because they represent companies with a history of increasing their dividends year after year, allowing investors to add a potentially passive income stream to their portfolio. A history of increasing dividends may indicate that a company is on a healthy financial path and may be able to continue paying dividends in the future. 

More Dividend Resources from MarketBeat

My Account -